- fake video's owner is ONE person
- he got no sources and he gets his source from jpn blog(anti-korea, anti-chinese)

 my next school vacation is coming soon now im collection materials
(comments, pics, videos made by koreans for making videos to arouse
those stupid southern pigs. More korean haters will be produced^^)

http://en.wikipedia.org/wiki/Haplogroup_O2b_(Y-DNA)
Haplogroup O2b (Y-DNA)
From Wikipedia, the free encyclopedia
| | This article does not cite any references or sources. Please help improve this article by adding citations to reliable sources (ideally, using inline citations). Unsourced material may be challenged and removed. (October 2006) |
Haplogroup O2b (SRY465, a.k.a. M176) is a human Y-chromosome DNA haplogroup. It is a descendant haplogroup of Haplogroup O2. Haplogroup O2b is found mainly in the northeastern parts of East Asia, from the Daur people of Inner Mongolia to the Japanese of Japan; however, haplogroup O2b has also been found at significant frequency among some populations of Southeast Asia, including those of Indonesia, Thailand, and Vietnam and from many people in Bangladesh.[1] This haplogroup is found with its highest frequency and diversity values among modern populations of Japan and Korea and is absent from most populations in China.[citation needed]
[edit] Subgroups
The phylogeography of Haplogroup O2b suggests a very ancient origin in Manchuria, followed by a long period of isolated evolution and population increase within the Korean Peninsula. Only the most ancient branches of this haplogroup, which are labeled as Haplogroup O2b*, have been detected among the indigenous populations of Inner Mongolia and Manchuria, and even then they are found only at very low frequencies. Haplogroup O2b* Y-chromosomes have been detected at a similarly low frequency among the Koreans, but Korean males display a very high frequency of a derived subclade, Haplogroup O2b1* (P49). In fact, Haplogroup O2b1* comes close to being the modal Y-chromosome haplogroup in Korea, occurring in approximately 35% of all Korean males.
A subclade of Haplogroup O2b1, namely Haplogroup O2b1a (47z), is found at a fairly high frequency among the Yamato people and Ryukyuan populations of Japan. Haplogroup O2b1a has been detected in approximately 22% of all males who speak a Japonic language, while it has not been found at all among the Ainu or Nivkhs of the northern extremes of the Japanese Archipelago. Based on the STR haplotype diversity within Haplogroup O2b1a, it has been estimated that this haplogroup began to experience a population expansion among the proto-Japanese of approximately 4,000 years ago, which makes it a good candidate for a marker of the intrusion of a Neolithic population of the prehistoric Korean Peninsula into the southwestern parts of the Japanese Archipelago. However, the parent haplogroup, O2b1*, is also found among Japanese, although at a relatively low frequency of approximately 4% to 7%, and the descendant haplogroup O2b1a is either completely absent from or found at only extremely low frequency (which could represent historical Japanese admixture) among samples of modern Koreans, which suggests the possibility that Haplogroup O2b1* might have colonized the Japanese Archipelago much earlier, with the subgroup O2b1a subsequently evolving within the proto-Japanese-Ryukyuan population of the western parts of the archipelago.
[edit] References
- ^ Han-Jun Jin, Kyoung-Don Kwak, Michael F. Hammer, Yutaka Nakahori, Toshikatsu Shinka, Ju-Won Lee, Feng Jin, Xuming Jia, Chris Tyler-Smith and Wook Kim, "Y-chromosomal DNA haplogroups and their implications for the dual origins of the Koreans," Human Genetics (2003)
http://en.wikipedia.org/wiki/Haplogroup_O2_(Y-DNA)
Although Haplogroup O2 is not found so frequently in modern human populations as its brother clade, Haplogroup O3, it is notable for the peculiarities of its geographical distribution. Like all clades of Haplogroup O, Haplogroup O2 is found only among the males of modern Eastern Eurasian populations. However, unlike Haplogroup O3, which is shared in common by almost all populations of Eastern Eurasia as well as many populations of Oceania, Haplogroup O2 is generally found only among certain populations, such as the Austroasiatic peoples of India, Bangladesh and Southeast Asia, the Nicobarese of the Nicobar Islands in the Indian Ocean, and the Koreans, Japanese, and Tungusic peoples of Northeast Asia.
Besides its widespread and patchy distribution, Haplogroup O2 is also notable for the fact that it can be divided into two major subclades that show almost completely disjoint distribution. One of these subclades, Haplogroup O2a (M95), is found among some (mostly tribal) populations of South and Southeast Asia, as well as among the Khmers of Cambodia and the Balinese of Indonesia. There are also some reports that Haplogroup O2a may be associated with the so-called Negrito populations of mainland Southeast Asia, such as the Semang and the Senoi, but it is not clear whether this is their original Y-chromosome heritage or rather the result of incursion of Austroasiatic Y-chromosomes from the Khmers and related peoples who may have lent the Negritos their Austroasiatic languages in a manner similar to the Bantus' hypothesized lending of their languages and Haplogroup E Y-chromosomes to the pygmoid peoples of Africa, such as the Baka and Mbuti. The other major subclade, Haplogroup O2b (SRY465, M176), is found almost exclusively among the Koreans, the Japanese, and the Manchus.
The Northeast Asian Haplogroup O2b suggests a very interesting sort of relationship between the Tungusic, Korean, and Japanese peoples. Haplogroup O2b's parent haplogroup, Haplogroup O2*, appears to have been thinly spread throughout East Asia since prehistoric times. The derived Haplogroup O2b* (M176) is found at low frequency across the populations of the whole of Greater Manchuria, including the Tungusic, Korean, Japanese, and even the Daur people, who speak a Mongolic language that has traditionally been considered to have derived from an ancient dialect transitional between the Proto-Mongolic and Proto-Tungusic languages. One major subbranch, O2b1* (P49), is shared between the Korean and Japanese populations (with a significantly higher STR diversity among the Koreans), but its distribution does not reach the Tungusic or Daur peoples to the north. Finally, the most derived subbranch, Haplogroup O2b1a (47z), is essentially restricted to the Japanese population, although it has sporadically been detected in a few individuals who reside within the extent of the erstwhile Great Japanese Empire, in which cases it is believed to represent minor admixture from male Japanese soldiers or civilians into the local populations within the last several generations; patrilineal descent from a Japanese visitor or immigrant to some of these lands during earlier historical times is another possibility. This "nested" hierarchical and region-specific distributional pattern tends to suggest the following sequence of events:
1) The M176 mutation that defines the O2b Y-chromosome lineage first arises on an ancestral O2* chromosome belonging to a man who already resides within Greater Manchuria, or who at least already belongs to a specific "proto-Tungus-Korean" tribe.
2) Sometime after the proto-Koreans have branched off from the other populations of the Greater Manchurian region, the P49 mutation that defines Haplogroup O2b1* arises in a proto-Korean male, whose lineage becomes very successful and increases in number among the prehistoric proto-Korean population.
3) One regional subgroup of the proto-Koreans distinguishes itself from the others either culturally or by physically migrating away from their proto-Korean brethren. After the split from the greater proto-Korean population is complete, the 47z mutation that defines Haplogroup O2b1a occurs in a male of this now proto-Japanese population, who produces many male descendants and increases the frequency of the O2b1a lineage among the proto-Japanese. This very specific Haplogroup O2b1a lineage now occupies about 42.5% of the total of Haplogroup O lineages, or about 22.0% of all Y-chromosomes, among the modern Japanese, which probably reflects extreme hegemony of a certain close-knit clan in the history of the Japanese people.
In addition to suggesting a phylogenetic relationship between at least a subset of the ancestors of the Tungusic, Korean, and Japanese peoples, the distribution of Haplogroup O2b and its subbranches also argues strongly against any significant intermingling of any of these peoples during historical times.
The other major Northeast Asian Y-chromosome haplogroup, Haplogroup C3, is also found among the Tungusic, Korean, and Japanese peoples, as well as among the Mongolian peoples, Turkic peoples, and even the Ainu of Japan and the Na-Dené peoples of North America, but Haplogroup C3 displays a cline of frequency opposite to that of Haplogroup O2, to the effect that Haplogroup C3 is more frequent among the more northerly populations (Mongolian, Turkic, Northern Tungusic, Koryak, Nivkh, etc.), whereas Haplogroup O2 is more frequent among the more southerly populations (Southern Tungusic, Korean, and Japanese), and it is entirely absent from the Ainu and Na-Dené populations. The typically Sino-Tibetan and Southeast Asian Haplogroup O3 is also shared in common by most Tungusic, Mongolic, Turkic, Korean, and Japanese populations with various frequency and diversity values, which may be a genetic trace of a demic diffusion of Neolithic culture from China; however, the common occurrence at a low frequency throughout Northeast Asia of Y-chromosome Haplogroup D1 and several mtDNA haplogroups that are typical of Tibetans in addition to the Sino-Tibetan-Austronesian Haplogroup O3 may reflect some sort of relationship between the peoples of Northeast Asia and the peoples of Tibet rather than a major Neolithic or even more recent influence from China.
------------------------------------------------------------------------
Haplogroup O1
http://en.wikipedia.org/wiki/Haplogroup_O1_(Y-DNA)Both Haplogroup O1 and Haplogroup O3 are prototypical Chinese patrilines, and they are believed to have first evolved sometime during the late Pleistocene (Upper Paleolithic) in Southeast Asia. Both O1 and O3 are commonly found among most modern populations of China and Southeast Asia. These two lineages are also presumed to be markers of the Austronesian expansion, probably originating from prehistoric Taiwan or the neighboring southeastern coast of China, when they are found among modern populations of Maritime Southeast Asia or Oceania.[1]
By far the strongest positive correlation between Haplogroup O1 and ethnolinguistic affiliation is that which is observed between this haplogroup and the Austronesians. It is interesting that the peak frequency of Haplogroup O1 is found among the aborigines of Taiwan, precisely the region from which linguists have hypothesized that the Austronesian language family originated. A slightly weaker correlation is observed between Haplogroup O1 and the Han Chinese populations of southern China, as well as between this haplogroup and the Kradai-speaking populations of southern China and Southeast Asia. The distribution of Daic languages in Thailand and other parts of Southeast Asia outside of China has long been believed, for reasons of traditional linguistic geography, to reflect a recent invasion of Southeast Asia by Daic-speaking populations originating from southeastern China, and the somewhat elevated frequency of Haplogroup O1 among the Daic populations, coupled with a high frequency of Haplogroup O2a, which is a genetic characteristic of the Austro-Asiatic peoples of Southeast Asia, suggests that the genetic signature of the Daic peoples' affinity with populations of southeastern China has been weakened due to extensive assimilation of the earlier Austro-Asiatic residents of the lands which the Daic peoples invaded. Also, it has been noted that Haplogroup O1 lineages among populations of continental Southeast Asia outside of China display a reduced level of diversity when compared with populations of South China and insular Southeast Asia, which may be evidence of a bottleneck associated with the westward migration and settlement of ancestral Daic-speaking populations in Indochina.
[edit] Distribution
Haplogroup O1 is generally found wherever its brother haplogroup, Haplogroup O3, is found, although at a frequency much lower than that of Haplogroup O3. A conspicuous exception to this general pattern is presented by the Taiwanese aboriginal populations, among whom Haplogroup O1 generally dominates Haplogroup O3 in frequency. The frequency of Haplogroup O1 has been found to be negatively correlated with latitude, so that, on average, it occurs at relatively higher frequency towards the more southerly parts of its range, but it never attains majority haplogroup status outside of Taiwan. Heightened frequencies of Haplogroup O1 have also been observed in samples of populations from the Philippines and the eastern-southeastern coast of China. This haplogroup is, however, conspicuously absent from populations of the Japanese Archipelago, which seems to preclude a close genetic relationship between the peoples of Japan and the Austronesians, despite many enthusiastic attempts to prove a common origin of the Japanese and Austronesian languages. Haplogroup O1a-M119 Y-chromosomes have also been found to occur at low frequency among various populations of Siberia, such as the Nivkhs (one of 17 sampled Y-chromosomes), Ulchi/Nanai (2/53), Yenisey Evenks (1/31), and especially the Buryats living in the Sayan-Baikal uplands of Irkutsk Oblast (6/13).[2]
[edit] Frequencies
The frequencies of Haplogroup O1 among various East Asian and Austronesian populations suggest a complex genetic history of the modern Han populations of southern China. Although Haplogroup O1 occurs only at an average frequency of approximately 4% among Han populations of northern China and peoples of southwestern China and Southeast Asia who speak Tibeto-Burman languages, the frequency of this haplogroup among the Han populations of southern China nearly quadruples to about 15%. It is particularly interesting that the frequency of Haplogroup O1 among the Southern Han has been found to be slightly greater than the arithmetic mean of the frequencies of Haplogroup O1 among the Northern Han and a pooled sample of Austronesian populations. This suggests that modern Southern Han populations possess a non-trivial number of male ancestors who were originally affiliated with some Austronesian-related culture, or who at least shared a genetic affinity with many of the ancestors of modern Austronesian peoples.
Subgroups
The subclades of Haplogroup O1 with their defining mutation, according to the 2006 ISOGG tree:
- O1 (MSY2.2)
- O1*
- O1a (M119) Typical of Austronesians, southern Han Chinese, and Tai-Kadai peoples
- O1a*
- O1a1 (M101)
- O1a2 (M50, M103, M110) Occurs among Austronesian peoples of Taiwan, the Philippines, Indonesia, Melanesia, Micronesia, and Madagascar as well as among some populations of continental Southeast Asia
[edit] References
- ^ Karafet et al. (February 2005), "Balinese Y-Chromosome Perspective on the Peopling of Indonesia: Genetic Contributions from Pre-Neolithic Hunter-Gatherers, Austronesian Farmers, and Indian Traders", Human Biology, 77: 93-114.
- ^ The Dual Origin and Siberian Affinities of Native American Y Chromosomes, Jeffrey T. Lell, Rem I. Sukernik, Yelena B. Starikovskaya, Bing Su, Li Jin, Theodore G. Schurr, Peter A. Underhill, and Douglas C. Wallace, American Journal of Human Genetics 70:192-206, 2002
3. Li et al. (2007) Y chromosomes of Prehistoric People along the Yangtze River[1]. Hum Genet 122:383-388.
4. Li et al. (2008) Paternal Genetic Affinity between Western Austronesians and Daic Populations[2]. BMC Evol Biol 8:146.
5. Li et al. (2008) Paternal Genetic Structure of Hainan Aborigines Isolated at the Entrance to East Asia[3]. PLoS ONE 3(5):e2168.
------------------------------------------------------------------------
Haplogroup O3 (Y-DNA)
http://en.wikipedia.org/wiki/Haplogroup_O3_(Y-DNA)Origins
Origins
Haplogroup O3 is a descendant haplogroup of haplogroup O. Some researchers believe that it first appeared in China approximately 10,000 years ago. However, others believe that the high internal diversity of Haplogroup O3 indicates a Late Pleistocene (Upper Paleolithic) origin in South China or Southeast Asia of the M122 mutation that defines the entire O3 clade, while the common presence among a wide variety of modern East and Southeast Asian nations of closely related haplotypes belonging to certain subclades of Haplogroup O3 is considered to point to a recent (e.g., Holocene) geographic dispersion of a certain subset of the ancient variation within Haplogroup O3. The spread of these particular subsets of Haplogroup O3 is conjectured to be closely associated with the sudden agricultural boom associated with rice farming.
The prehistoric peopling of East Asia by modern humans remains controversial with respect to early population migrations. In a systematic sampling and genetic screening of an East Asian–specific Y-chromosome haplogroup (O3-M122) in 2,332 individuals from diverse East Asian populations. Results indicate that the O3-M122 lineage is dominant in East Asian populations, with an average frequency of 44.3%. The microsatellite data show that the O3-M122 haplotypes in southern East Asia are more diverse than those in northern East Asia, suggesting a southern origin of the O3-M122 mutation. It was estimated that the early northward migration of the O3-M122 lineages in East Asia occurred ~25,000–30,000 years ago, consistent with the fossil records of modern humans in East Asia. [1]
[edit] Distribution
Although Haplogroup O3 appears to be primarily associated with Chinese populations, it also forms a significant component of the Y-chromosome diversity of most modern populations of the East Asian region. Haplogroup O3 is found in over 50% of all modern Chinese males (ranging up to over 80% in certain regional subgroups of the Han ethnicity), about 40% of Manchurian, Korean, and Vietnamese males, about 33.3%[2] to 60.7%[3] of Filipino males, about 35% of Malaysian males, about 25% of Zhuang[4] and Indonesian[5] males, and about 15%[6] to 20%[2] of Japanese males. The distribution of Haplogroup O3 stretches far into Central Asia (approx. 30% of Salar, 24% of Dongxiang[7], 18% to 22.8% of Mongolians, 12% of Uyghurs, 9% of Kazakhs, 6.2% of Altayans[8], and 4.1% of Uzbeks) and Oceania (approx. 25% of Polynesians, 18% of Micronesians, and 5% of Melanesians[9]), albeit with reduced frequencies of most subclades. It should be noted that Haplogroup O3* Y-chromosomes, which are not defined by any identified downstream markers, are actually more common among certain non-Han Chinese populations than among Han Chinese ones, and the presence of these O3* Y-chromosomes among various populations of Central Asia, East Asia, and Oceania is more likely to reflect a very ancient shared ancestry of these populations rather than the result of any historical events. It remains to be seen whether Haplogroup O3* Y-chromosomes can be parsed into distinct subclades that display significant geographical or ethnic correlations.
Among all the populations of East and Southeast Asia, Haplogroup O3 is most closely associated with those that speak a Sinitic, Tibeto-Burman, or Hmong-Mien language. Haplogroup O3 comprises about 50% or more of the total Y-chromosome variation among the populations of each of these language families. The Sinitic and Tibeto-Burman language families are generally believed to be derived from a common Sino-Tibetan protolanguage, and most linguists place the homeland of the Sino-Tibetan language family somewhere in northern China. The Hmong-Mien languages and cultures, for various archaeological and ethnohistorical reasons, are also generally believed to have derived from a source somewhere north of their current distribution, perhaps in northern or central China. The Tibetans, however, despite the fact that they speak a language of the Tibeto-Burman language family, have high percentages of the otherwise rare haplogroups D1 and D3, which are also found at much lower frequencies among the members of some other ethnic groups in East Asia and Central Asia.
Haplogroup O3 has been implicated as a diagnostic genetic marker of the Austronesian expansion when it is found in populations of Oceania. Its distribution in Oceania is mostly limited to the traditionally Austronesian culture zones, including moderately high frequencies in the Philippines, Malaysia, Indonesia, and Polynesia, with generally lower frequencies found in coastal and island Melanesia, Micronesia, and Taiwanese aboriginal tribes.
The subgroup O3a5-M134 is particularly closely associated with Sino-Tibetan populations, and it is generally not found outside of areas where a Sino-Tibetan language is currently spoken or that are historically supposed to have undergone Chinese colonization or immigration, such as Korea, Japan, Vietnam, Malaysia, the Philippines, and Indonesia. However, its presence among non-Sino-Tibetan populations is always very limited and never amounts to more than 10% of the total Y-chromosome diversity. There are also reports that Y-chromosomes belonging to Haplogroup O3a5 have been sampled from populations of such far-flung places as Western Samoa. Surprisingly, Haplogroup O3a5-M134 Y-chromosomes have also been found in about 1% to 3% of indigenous Australian men in the northwest of that continent, which might indicate that a certain degree of contact has occurred between the Austronesian expansion from Asia and some indigenous Australian populations. The fact that Haplogroup O3a5 is so strongly associated with Chinese populations, however, and the fact that no Y-chromosome haplogroups characteristic of Austronesian populations have been found among these indigenous Australian populations may be taken to suggest the possibility of some direct Chinese-Australian contact in the precolonial era. Within Japan, the subgroup O3a5-M134 forms the majority of the haplogroup O3 Y-chromosomes detected.
Haplogroup O3's brother clade, Haplogroup O1, displays a similar geographical distribution, being found among nearly all the populations of East and Southeast Asia, but generally at a frequency much lower than that of Haplogroup O3. Another brother clade, Haplogroup O2, has an impressive extent of dispersal, as it is found among the males of populations as widely separated as the Kolarians of India and the Japanese of Japan; however, Haplogroup O2's distribution is much more patchy, and the Haplogroup O2 Y-chromosomes found among the Mundas and the Japanese belong to distinct subclades.
[edit] References
1. ^ Hong Shi, Yong-li Dong, Bo Wen, Chun-Jie Xiao, Peter A. Underhill, Pei-dong Shen, Ranajit Chakraborty, Li Jin, and Bing Su, "Y-Chromosome Evidence of Southern Origin of the East Asian–Specific Haplogroup O3-M122" American Journal of Human Genetics 77:408–419, 2005 (HTML) (PDF)
2. ^ a b Dual origins of the Japanese: common ground for hunter-gatherer and farmer Y chromosomes, Michael F. Hammer et al., Journal of Human Genetics (Jan. 2006)
3. ^ Matthew E. Hurles, Bryan C. Sykes, Mark A. Jobling, and Peter Forster, "The Dual Origin of the Malagasy in Island Southeast Asia and East Africa: Evidence from Maternal and Paternal Lineages," American Journal of Human Genetics 76:894–901, 2005.
4. ^ Chen Jing, Li Hui et al., "Y-chromosome Genotyping and Genetic Structure of Zhuang Populations," Acta Genetica Sinica (Dec. 2006)
5. ^ Hui Li, Bo Wen, Shu-Juo Chen, Bing Su, Patcharin Pramoonjago, Yangfan Liu, Shangling Pan, Zhendong Qin, Wenhong Liu, Xu Cheng, Ningning Yang, Xin Li, Dinhbinh Tran, Daru Lu, Mu-Tsu Hsu, Ranjan Deka, Sangkot Marzuki, Chia-Chen Tan and Li Jin, "Paternal genetic affinity between western Austronesians and Daic populations," BMC Evolutionary Biology 2008, 8:146 doi:10.1186/1471-2148-8-146. http://www.biomedcentral.com/1471-2148/8/146
6. ^ Y-chromosomal Binary Haplogroups in the Japanese Population and their Relationship to 16 Y-STR Polymorphisms, I. Nonaka et al., Annals of Human Genetics (Feb. 2007)
7. ^ Wei Wang, Cheryl Wise, Tom Baric, Michael L. Black and Alan H. Bittles, "The origins and genetic structure of three co-resident Chinese Muslim populations: the Salar, Bo'an and Dongxiang," Human Genetics (2003)
8. ^ V. N. Kharkov, V. A. Stepanov, O. F. Medvedeva, M. G. Spiridonova, M. I. Voevoda, V. N. Tadinova and V. P. Puzyrev, "Gene pool differences between Northern and Southern Altaians inferred from the data on Y-chromosomal haplogroups," Russian Journal of Genetics, Volume 43, Number 5 (May, 2007)
9. ^ Balinese Y-Chromosome Perspective on the Peopling of Indonesia: Genetic Contributions from Pre-Neolithic Hunter-Gatherers, Austronesian Farmers, and Indian Traders, Tatiana M. Karafet, J. S. Lansing, Alan J. Redd, Joseph C. Watkins, S. P. K. Surata, W. A. Arthawiguna, Laura Mayer, Michael Bamshad, Lynn B. Jorde, and Michael F. Hammer, Human Biology (Feb. 2005)
9. Gan Rui-Jing, Pan Shang-Ling, Mustavich Laura F, Qin Zhen-Dong, Cai Xiao-Yun, Qian Ji, Liu Cheng-Wu, Peng Jun-Hua, Li Shi-Lin, Xu Jie-Shun, Jin Li, Li Hui*: the Genographic Consortium (2008) Pinghua Population as an Exception of Han Chinese's Coherent Genetic Structure [1]. J Hum Genet 53:303-313.
Truth
http://en.wikipedia.org/wiki/O2b
The phylogeography of Haplogroup O2b suggests a very ancient origin in Manchuria, followed by a long period of isolated evolution and population increase within the Korean Peninsula.
http://en.wikipedia.org/wiki/Haplogroup_O2_(Y-DNA)
Haplogroup O2 is also notable for the fact that it can be divided into two major subclades that show almost completely disjoint distribution.
1: One of these subclades, Haplogroup O2a (M95), is found among some (mostly tribal) populations of South and Southeast Asia, as well as among the Khmers of Cambodia and the Balinese of Indonesia. There are also some reports that Haplogroup O2a may be associated with the so-called Negrito populations of mainland Southeast Asia, such as the Semang and the Senoi, but it is not clear whether this is their original Y-chromosome heritage or rather the result of incursion of Austroasiatic Y-chromosomes from the Khmers and related peoples who may have lent the Negritos their Austroasiatic languages in a manner similar to the Bantus' hypothesized lending of their languages and Haplogroup E Y-chromosomes to the pygmoid peoples of Africa, such as the Baka and Mbuti.
2: The other major subclade, Haplogroup O2b (SRY465, M176), is found almost exclusively among the
Koreans, the Japanese, and the Manchus.
http://en.wikipedia.org/wiki/Haplogroup_K_(Y-DNA)
Haplogroup K (Y-DNA)
From Wikipedia, the free encyclopedia
| Haplogroup K | |
| Time of origin | 35,000-40,000 years BP |
| Place of origin | Southwest Asia |
| Ancestor | IJK |
| Descendants | L, M, NOP, S and T |
|---|---|
| Defining mutations | M9 |
In human genetics, Haplogroup K (M9) is a Human Y-chromosome DNA haplogroup. This haplogroup is a descendant of Haplogroup IJK. Its major descendant haplogroups are L (M20), M (P256), NO (M214) (plus NO's descendants N and O), P (M45) (plus P's descendants Q and R), S (M230), and T (M70). Haplogroups K1, K2, K3 and K4 are found only at low frequency in South Asia, the Malay Archipelago, Oceania, and Australia.
Contents[hide] |
[edit] Origins
Y-DNA haplogroup K is an old lineage established approximately 40,000 thousand years ago whose origins were probably in southwestern Asia. At present this group contains two distinct classes of subgroups: (1) major groups L to T (refer to the main tree at Y-DNA Haplogroup Tree) and (2) minor groups K* and K1 to K4 which do not have any of the SNPs defining the major groups. These groups are found at low frequencies in various parts of Africa, Eurasia, Australia and the South Pacific.[1]
[edit] Subgroups
The subclades of Haplogroup K with their defining mutation, according to Karafet et al (2008) [2] (abbreviated for clarity to a maximum of five steps away from the root of Haplogroup K):
Note The 2008 paper made a number of changes compared to the previous 2006 ISOGG tree. The former subgroups K2 and K5 were renamed Haplogroups T and S; the old subgroups K1 and K7 were re-assigned as new subgroups M2 and M3 of a redefined Haplogroup M; and the former subgroups K3, K4 and K6 were renamed to new K1, K2 and K3.
- K (M9) Typical of populations of northern Eurasia, eastern Eurasia, Melanesia, and the Americas, with a moderate distribution throughout Southwest Asia, northern Africa, and Oceania
- K*
- K1 (M147) Found at low frequencies in South Asia
- K2 (P60)
- K3 (P79) Found in Melanesia
- K4 (P261, P263)
- L (M11, M20, M22, M61, M185, M295) Typical of populations of Pakistan
- L*
- L1 (M27, M76) Typical of Indians and Sri Lankans, with a moderate distribution among Indo-Iranian populations of South Asia
- L2 (M317) Found at low frequency in Central Asia, Southwest Asia, and Southern Europe
- L2*
- L2a (M274)
- L2b (M349)
- L3 (M357) Found frequently among Burusho and Pashtuns, with a moderate distribution among the general Pakistani population
- L3*
- L3a (PK3) Found among Kalash
- M (P256)
- M1 (M4, M5, M106, M186, M189, P35) Typical of Papuan peoples
- M1*
- M1a (P34)
- M1a*
- M1a1 (P51)
- M1b (P87)
- M1b*
- M1b1 (M104 (P22)) Typical of populations of the Bismarck Archipelago and Bougainville Island[1]
- M1b1*
- M1b1a (M16)
- M1b1b (M83)
- M2 (M353, M387) Found at a low frequency in the Solomon Islands and Fiji
- M2*
- M2a (SRY9138 (M177))
- M3 (P117) Found in Melanesia
- M1 (M4, M5, M106, M186, M189, P35) Typical of Papuan peoples
- NO (M214)
- NO*
- N (M231)
- N*
- N1 (LLY22g)
- N1a (M128) Found at a low frequency among Manchu, Sibe, Manchurian Evenks, Koreans, northern Han Chinese, Buyei, and some Turkic peoples of Central Asia
- N1b (P43) Typical of Northern Samoyedic peoples; also found at low to moderate frequency among some other Uralic peoples, Turkic peoples, Mongolic peoples, Tungusic peoples, and Siberian Yupiks
- N1b*
- N1b1 (P63)
- N1c (Tat (M46), P105) Typical of the Sakha and Uralic peoples, with a moderate distribution throughout North Eurasia
- N1c*
- N1c1 (M178)
- N1c1*
- N1c1a (P21)
- N1c1b (P67)
- N1c1c (P119)
- O (M175)
- O*
- O1 (MSY2.2) Typical of Austronesians, southern Han Chinese, and Kradai peoples
- O1*
- O1a (M119)
- O1a*
- O1a1 (M101)
- O1a2 (M50, M103, M110)
- O2 (P31, M268)
- O2*
- O2a (M95) Typical of Austro-Asiatic peoples, Kradai peoples, Malays, Indonesians, and Malagasy, with a moderate distribution throughout South Asia, Southeast Asia, East Asia, and Central Asia
- O2a*
- O2a1 (M88, M111)
- O2a2 (M297)
- O2b (M176/SRY465, P49, 022454)
- O2b* Typical of Koreans, with a moderate distribution among populations of Indonesia, Japan, Manchuria, Micronesia, Thailand, and Vietnam
- O2b1 (47z) Typical of Japanese and Ryukyuans, with a moderate distribution among Indonesians, Thais, Koreans, and Vietnamese
- O3 (M122) Typical of populations of East Asia, Southeast Asia, and culturally Austronesian regions of Oceania, with a moderate distribution in Central Asia
- O3*
- O3a (M324, P93, P197, P198, P199, P200)
- O3a*
- O3a1 (DYS257/P27.2, M121)
- O3a2 (M164)
- O3a3 (P201/021354)
- O3a3*
- O3a3a (M159)
- O3a3b (M7) Typical of Hmong-Mien peoples, with a moderate distribution among Han Chinese, Buyei, Qiang, and Oroqen[2]
- O3a3c (M134) Typical of Sino-Tibetan peoples, with a moderate distribution throughout East Asia and Southeast Asia
- O3a4 (002611)
- O3a4*
- O3a4a (P103)
- O3a5 (M300)
- O3a6 (M333)
- P (92R7, M45, M74, (N12), P27)
- P*
- Q (M242)
- Q*
- Q1 (P36.2)
- Q1*
- Q1a (MEH2)
- Q1a*
- Q1a1 (M120, M265/N14) Found at low frequency among Chinese, Koreans, Dungans, and Hazara[3][4]
- Q1a2 (M25, M143) Found at low to moderate frequency among some populations of Southwest Asia, Central Asia, and Siberia
- Q1a3 (M346)
- Q1a3* Found at low frequency in Pakistan and India
- Q1a3a (M3) Typical of indigenous peoples of the Americas
- Q1a3a*
- Q1a3a1 (M19) Found among some indigenous peoples of South America, such as the Ticuna and the Wayuu[5]
- Q1a3a2 (M194)
- Q1a3a3 (M199, P106, P292)
- Q1a4 (P48)
- Q1a5 (P89)
- Q1a6 (M323) Found in a significant minority of Yemeni Jews
- Q1b (M378) Found at low frequency among samples of Hazara and Sindhis
- R (M207 (UTY2), M306 (S1), S4, S8, S9)
- R*
- R1 (M173)
- R1*
- R1a (SRY10831.2 (SRY1532))
- R1a*
- R1a1 (M17, M198) Typical of populations of Eastern Europe, Central Asia, and South Asia, with a moderate distribution throughout Western Europe, Southwest Asia, and southern Siberia
- R1b (M343) Typical of populations of Western Europe, with a moderate distribution throughout Eurasia and in parts of Africa
- R1b*
- R1b1 (P25)
- R2 (M124) Typical of populations of South Asia, with a moderate distribution in Central Asia and the Caucasus
- S (M230) Typical of populations of the highlands of New Guinea; also found at lower frequencies in adjacent parts of Indonesia and Melanesia
- S*
- S1 (M254)
- S1*
- S1a (M226)
- T (M70, M184, M193, M272) Found in a significant minority of Somalis, Ethiopians, Fulbe, Egyptians, Omani & Serbian people; also found at low frequency throughout the Mediterranean and parts of India
- T*
- T1 (M320)
[edit] References
- ^ Laura Scheinfeldt, Françoise Friedlaender, Jonathan Friedlaender, Krista Latham, George Koki, Tatyana Karafet, Michael Hammer and Joseph Lorenz, "Unexpected NRY Chromosome Variation in Northern Island Melanesia," Molecular Biology and Evolution 2006 23(8):1628-1641
- ^ Yali Xue, Tatiana Zerjal, Weidong Bao, Suling Zhu, Qunfang Shu, Jiujin Xu, Ruofu Du, Songbin Fu, Pu Li, Matthew E. Hurles, Huanming Yang, and Chris Tyler-Smith, "Male Demography in East Asia: A North–South Contrast in Human Population Expansion Times," Genetics 2006 April; 172(4): 2431–2439.
- ^ Supplementary Table 2: NRY haplogroup distribution in Han populations, from the online supplementary material for the article by Bo Wen et al., "Genetic evidence supports demic diffusion of Han culture," Nature 431, 302-305 (16 September 2004)
- ^ Table 1: Y-chromosome haplotype frequencies in 49 Eurasian populations, listed according to geographic region, from the article by R. Spencer Wells et al., "The Eurasian Heartland: A continental perspective on Y-chromosome diversity," Proceedings of the National Academy of Sciences of the United States of America (August 28, 2001)
- ^ "Y-Chromosome Evidence for Differing Ancient Demographic Histories in the Americas," Maria-Catira Bortolini et al., American Journal of Human Genetics 73:524-539, 2003
- O (M175)
- O*
- O1 (MSY2.2) Typical of Austronesians, southern Han Chinese, and Kradai peoples
- O1*
- O1a (M119)
- O1a*
- O1a1 (M101)
- O1a2 (M50, M103, M110)
- O2 (P31, M268)
- O2*
- O2a (M95) Typical of Austro-Asiatic peoples, Kradai peoples, Malays, Indonesians, and Malagasy, with a moderate distribution throughout South Asia, Southeast Asia, East Asia, and Central Asia
- O2a*
- O2a1 (M88, M111)
- O2a2 (M297)
- O2b (M176/SRY465, P49, 022454)
- O2b* Typical of Koreans, with a moderate distribution among populations of Indonesia, Japan, Manchuria, Micronesia, Thailand, and Vietnam
- O2b1 (47z) Typical of Japanese and Ryukyuans, with a moderate distribution among Indonesians, Thais, Koreans, and Vietnamese
- O3 (M122) Typical of populations of East Asia, Southeast Asia, and culturally Austronesian regions of Oceania, with a moderate distribution in Central Asia
- O3*
- O3a (M324, P93, P197, P198, P199, P200)
- O3a*
- O3a1 (DYS257/P27.2, M121)
- O3a2 (M164)
- O3a3 (P201/021354)
- O3a3*
- O3a3a (M159)
- O3a3b (M7) Typical of Hmong-Mien peoples, with a moderate distribution among Han Chinese, Buyei, Qiang, and Oroqen[2]
- O3a3c (M134) Typical of Sino-Tibetan peoples, with a moderate distribution throughout East Asia and Southeast Asia
- O3a4 (002611)
- O3a4*
- O3a4a (P103)
- O3a5 (M300)
- O3a6 (M333)


http://www.imbice.org.ar/es/lab_06_b/06.pdf
-------------------------------------------------------------------------
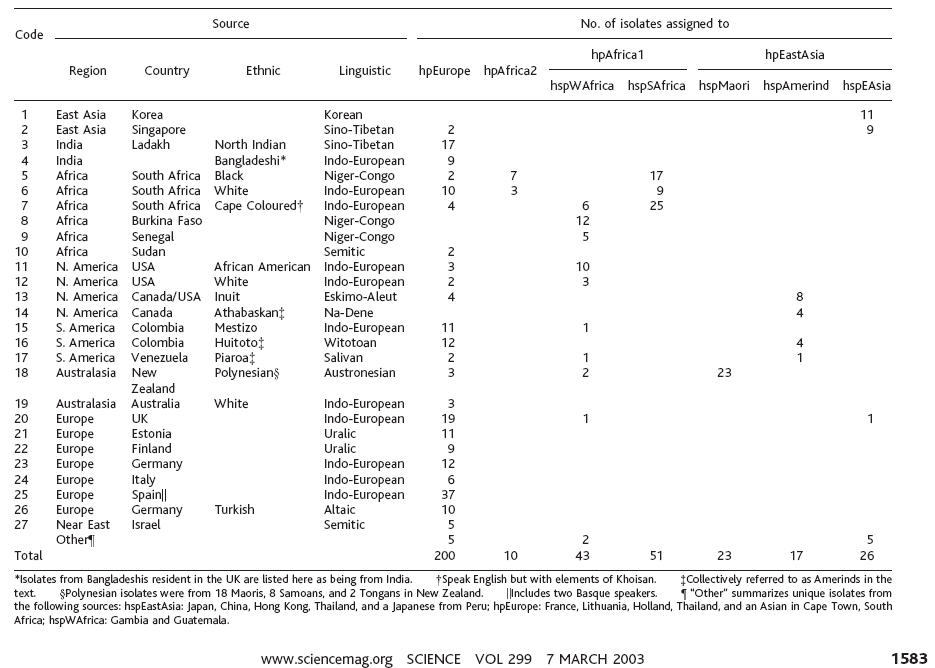
http://pritch.bsd.uchicago.edu/publications/FalushEtAl03_Science.pdf
Daniel Falush, Thierry Wirth, Bodo Linz, Jonathan K. Pritchard, Matthew Stephens, Mark Kidd, Martin J. Blaser, David Y. Graham, Sylvie Vacher, Guillermo I. Perez-Perez, Yoshio Yamaoka, Francis Mégraud, Kristina Otto, Ulrike Reichard, Elena Katzowitsch, Xiaoyan Wang, Mark Achtman, and Sebastian Suerbaum
Science 7 March 2003; 299: 1582-1585
Jared Diamond and Peter Bellwood
Science 25 April 2003; 300: 597-603


-------------------------------------------
According to the latest 2007 genetic/DNA study by Jiang Ya-ping at Labs of Cellular and Molecular Evolution in Kunming Institute of Zoology, China,
the , contradicting the theory of "Beijing Apes"
http://en.wikipedia.org/wiki/Altaic_languages
Altaic languages
From Wikipedia, the free encyclopedia
| Altaic | |
|---|---|
| Geographic distribution: | East, North, Central, and West Asia and Eastern Europe |
| Genetic classification: | Altaic |
| Subdivisions: | Japonic (usually included) |
| ISO 639-2 and 639-5: | tut |
Altaic is a disputed language family that is generally held by its proponents to include the Turkic, Mongolic, Tungusic, Korean, and Japonic language families (Georg et al. 1999:73-74).[1] These languages are spoken in a wide arc stretching from northeast Asia through Central Asia to Anatolia and eastern Europe (Turks, Kalmyks).[2] The group is named after the Altai Mountains, a mountain range in Central Asia.
These language families share numerous characteristics. The debate is over the origin of their similarities. One camp, often called the "Altaicists", views these similarities as arising from common descent from a Proto-Altaic language spoken several thousand years ago. The other camp, often called the "anti-Altaicists", views these similarities as arising from areal interaction between the language groups concerned. Some linguists believe the case for either interpretation is about equally strong; they have been called the "skeptics" (Georg et al. 1999:81).
Another view accepts Altaic as a valid family but includes in it only Turkic, Mongolic, and Tungusic. This view was widespread prior to the 1960s, but has almost no supporters among specialists today (Georg et al. 1999:73-74). The expanded grouping, including Korean and, from the early 1970s on, Japanese, came to be known as "Macro-Altaic", leading to the designation by back-formation of the smaller grouping as "Micro-Altaic". A minority of Altaicists continues to support the inclusion of Korean but not that of Japanese (Poppe 1976:470, Georg et al. 1999:65, 74).
Micro-Altaic would include about 66 living languages,[3] to which Macro-Altaic would add Korean, Japanese, and the Ryukyuan languages for a total of about 74. (These are estimates, depending on what is considered a language and what is considered a dialect. They do not include earlier states of language, such as Old Japanese.) Micro-Altaic would have a total of about 348 million speakers today, Macro-Altaic about 558 million.
The history of the Altaic idea is detailed below, as well as the case against it.

Contents
[hide]- 1 History of the Altaic idea
- 2 A language family or a Sprachbund?
- 3 Postulated Urheimat
- 4 List of Altaicists and critics of Altaic
- 5 Comparative grammar of the proposed Altaic language family
- 6 Modern peoples
- 7 Bibliography
- 8 See also
- 9 External links
Works cited
- Aalto, Pentti. 1955. "On the Altaic initial *p-." Central Asiatic Journal 1, 9–16.
- Anthony, David W. 2007. The Horse, the Wheel, and Language. Princeton: Princeton University Press.
- Blažek, Václav. 2006. "Current progress in Altaic etymology." Linguistica Online, 30 January 2006.
- Boller, Anton. 1857. Nachweis, daß das Japanische zum ural-altaischen Stamme gehört. Wien.
- Clauson, Gerard. 1956. "The case against the Altaic theory." Central Asiatic Journal 2, 181–187.
- Clauson, Gerard. 1959. "The case for the Altaic theory examined." Akten des vierundzwanzigsten internationalen Orientalisten-Kongresses, edited by H. Franke. Wiesbaden: Deutsche Morgenländische Gesellschaft, in Komission bei Franz Steiner Verlag.
- Clauson, Gerard. 1968. "A lexicostatistical appraisal of the Altaic theory." Central Asiatic Journal 13: 1-23.
- Doerfer, Gerhard. 1963. "Bemerkungen zur Verwandtschaft der sog. altaische Sprachen", 'Remarks on the relationship of the so-called Altaic languages'. In Gerhard Doerfer, Türkische und mongolische Elemente im Neupersischen, Bd. I: Mongolische Elemente im Neupersischen, 1963, 51–105. Wiesbaden: Franz Steiner Verlag.
- Doerfer, Gerhard. 1973. "Lautgesetze und Zufall: Betrachtungen zum Omnicomparativismus." Innsbrucker Beiträge zur Sprachwissenschaft 10.
- Doerfer, Gerhard. 1974. "Ist das Japanische mit den altaischen Sprachen verwandt?" Zeitschrift der Deutschen Morgenländischen Gesellschaft 114.1.
- Doerfer, Gerhard. 1985. Mongolica-Tungusica. Wiesbaden: Otto Harrassowitz.
- Doerfer, Gerhard. 1988. Grundwort und Sprachmischung: Eine Untersuchung an Hand von Körperteilbezeichnungen. Wiesbaden: Franz Steiner Verlag.
- Dybo, Anna V. and Georgiy S. Starostin. 2008. "In defense of the comparative method, or the end of the Vovin controversy." Aspects of Comparative Linguistics 3, 109–258. Moscow: RSUH Publishers.
- Georg, Stefan, Peter A. Michalove, Alexis Manaster Ramer, and Paul J. Sidwell. 1999. "Telling general linguists about Altaic." Journal of Linguistics 35:65-98. Cambridge: Cambridge University Press.
- Georg, Stefan. 1999 / 2000. "Haupt und Glieder der altaischen Hypothese: die Körperteilbezeichnungen im Türkischen, Mongolischen und Tungusischen" ('Head and members of the Altaic hypothesis: The body-part designations in Turkic, Mongolic, and Tungusic'). Ural-altaische Jahrbücher, neue Folge B 16, 143–182.
- Georg, Stefan. 2004. Review of Etymological Dictionary of the Altaic Languages. Diachronica 21.2, 445-450.
- Georg, Stefan. 2005. "Reply [to Starostin 2005]." Diachronica 22.2, 455–457.
- Greenberg, Joseph H. 2000–2002. Indo-European and Its Closest Relatives: The Eurasiatic Language Family, 2 volumes. Stanford: Stanford University Press.
- Manaster Ramer, Alexis and Paul Sidwell. 1997. "The truth about Strahlenberg's classification of the languages of Northeastern Eurasia." Journal de la Société finno-ougrienne 87, 139–160.
- Menges, Karl. H. 1975. Altajische Studien II. Japanisch und Altajisch. Wiesbaden: Franz Steiner Verlag.
- Mallory, J.P. 1989. In Search of the Indo-Europeans. London: Thames and Hudson.
- Miller, Roy Andrew. 1971. Japanese and the Other Altaic Languages. Chicago: University of Chicago Press. ISBN 0226527190.
- Miller, Roy Andrew. 1980. Origins of the Japanese Language: Lectures in Japan during the Academic Year 1977–78. Seattle: University of Washington Press. ISBN 0295957662.
- Miller, Roy Andrew. 1986. Nihongo: In Defence of Japanese. London: Athlone Press. ISBN 0485112515.
- Miller, Roy Andrew. 1991. "Genetic connections among the Altaic languages." In Sydney M. Lamb and E. Douglas Mitchell (editors), Sprung from Some Common Source: Investigations into the Prehistory of Languages, 1991, 293–327. ISBN 0804718970.
- Miller, Roy Andrew. 1996. Languages and History: Japanese, Korean and Altaic. Oslo: Institute for Comparative Research in Human Culture. ISBN 9748299694.
- Patrie, James. 1982. The Genetic Relationship of the Ainu Language. University of Hawaii Press. ISBN 0824807243.
- Poppe, Nicholas. 1960. Vergleichende Grammatik der altaischen Sprachen. Teil I. Vergleichende Lautlehre, 'Comparative Grammar of the Altaic Languages, Part 1: Comparative Phonology'. Wiesbaden: Otto Harrassowitz. (Only part to appear of a projected larger work.)
- Poppe, Nicholas. 1965. Introduction to Altaic Linguistics. Ural-altaische Bibliothek 14. Wiesbaden: Otto Harrassowitz.
- Poppe, Nicholas. 1976. Review of Karl H. Menges, Altajische Studien II. Japanisch und Altajisch (1975). In The Journal of Japanese Studies 2.2, 470–474.
- Ramstedt, G.J. 1952. Einführung in die altaische Sprachwissenschaft II. Formenlehre, 'Introduction to Altaic Linguistics, Volume 2: Morphology', edited and published by Pentti Aalto. Helsinki: Suomalais-Ugrilainen Seura.
- Ramstedt, G.J. 1957. Einführung in die altaische Sprachwissenschaft I. Lautlehre, 'Introduction to Altaic Linguistics, Volume 1: Phonology', edited and published by Pentti Aalto. Helsinki: Suomalais-Ugrilainen Seura.
- Ramstedt, G.J. 1966. Einführung in die altaische Sprachwissenschaft III. Register, 'Introduction to Altaic Linguistics, Volume 3: Index', edited and published by Pentti Aalto. Helsinki: Suomalais-Ugrilainen Seura.
- Robbeets, Martine. 2005. Is Japanese related to Korean, Tungusic, Mongolic and Turkic? Wiesbaden: Otto Harrassowitz.
- Robbeets, Martine. 2007. "How the actional suffix chain connects Japanese to Altaic." In Turkic Languages 11.1, 3–58.
- Schönig, Claus. 2003. "Turko-Mongolic Relations." In The Mongolic Languages, edited by Juha Janhunen, 403–419. London: Routledge.
- Starostin, Sergei A. 1991. Altajskaja problema i proisxoždenie japonskogo jazyka, 'The Altaic Problem and the Origin of the Japanese Language'. Moscow: Nauka.
- Starostin, Sergei A., Anna V. Dybo, and Oleg A. Mudrak. 2003. Etymological Dictionary of the Altaic Languages, 3 volumes. Leiden: Brill Academic Publishers. ISBN 9004131531.
- Starostin, Sergei A. 2005. "Response to Stefan Georg's review of the Etymological Dictionary of the Altaic Languages." Diachronica 22(2), 451–454.
- Strahlenberg, P.J.T. von. 1730. Das nord- und ostliche Theil von Europa und Asia.... Stockholm. (Reprint: 1975. Studia Uralo-Altaica. Szeged and Amsterdam.)
- Strahlenberg, P.J.T. von. 1738. Russia, Siberia and Great Tartary, an Historico-geographical Description of the North and Eastern Parts of Europe and Asia.... (Reprint: 1970. New York: Arno Press.) English translation of the previous.
- Street, John C. 1962. Review of N. Poppe, Vergleichende Grammatik der altaischen Sprachen, Teil I (1960). Language 38, 92–98.
- Tekin, Talat. 1994. "Altaic languages." In The Encyclopedia of Language and Linguistics, Vol. 1, edited by R.E. Asher. Oxford and New York: Pergamon Press.
- Unger, J. Marshall. 1990. "Summary report of the Altaic panel." In Linguistic Change and Reconstruction Methodology, edited by Philip Baldi, 479–482. Berlin - New York: Mouton de Gruyter.
- Vovin, Alexander. 1993. "About the phonetic value of the Middle Korean grapheme ᅀ." Bulletin of the School of Oriental and African Studies 56(2), 247–259.
- Vovin, Alexander. 1994. "Genetic affiliation of Japanese and methodology of linguistic comparison." Journal de la Société finno-ougrienne 85, 241–256.
- Vovin, Alexander. 2001. "Japanese, Korean, and Tungusic: evidence for genetic relationship from verbal morphology." Altaic Affinities (Proceedings of the 40th Meeting of PIAC, Provo, Utah, 1997), edited by David B. Honey and David C. Wright, 83–202. Indiana University, Research Institute for Inner Asian Studies.
- Vovin, Alexander. 2005. "The end of the Altaic controversy" (review of Starostin et al. 2003). Central Asiatic Journal 49.1, 71–132.
- Whitney Coolidge, Jennifer. 2005. Southern Turkmenistan in the Neolithic: A Petrographic Case Study. Oxbow Books.
- 이기문, 국어사 개설, 탑출판사, 1991.
[edit] Further reading
- Greenberg, Joseph H. 1997. "Does Altaic exist?" In Irén Hegedus, Peter A. Michalove, and Alexis Manaster Ramer (editors), Indo-European, Nostratic and Beyond: A Festschrift for Vitaly V. Shevoroshkin, Washington, DC: Institute for the Study of Man, 1997, 88–93. (Reprinted in Joseph H. Greenberg, Genetic Linguistics, Oxford: Oxford University Press, 2005, 325–330.)
- Hahn, Reinhard F. 1994. LINGUIST List 5.908, 18 Aug 1994.
- Janhunen, Juha. 1992. "Das Japanische in vergleichender Sicht." Journal de la Société finno-ougrienne 84, 145-61.
- Johanson, Lars. 1999. "Cognates and copies in Altaic verb derivation." Language and Literature – Japanese and the Other Altaic Languages: Studies in Honour of Roy Andrew Miller on His 75th Birthday, edited by Karl H. Menges and Nelly Naumann, 1-13. Wiesbaden: Otto Harrassowitz. (Also: HTML version.)
- Johanson, Lars. 1999. "Attractiveness and relatedness: Notes on Turkic language contacts." Proceedings of the Twenty-fifth Annual Meeting of the Berkeley Linguistics Society: Special Session on Caucasian, Dravidian, and Turkic Linguistics, edited by Jeff Good and Alan C.L. Yu, 87-94. Berkeley: Berkeley Linguistics Society.
- Johanson, Lars. 2002. Structural Factors in Turkic Language Contacts, translated by Vanessa Karam. Richmond, Surrey: Curzon Press.
- Kortlandt, Frederik. 1993. "The origin of the Japanese and Korean accent systems." Acta Linguistica Hafniensia 26, 57–65.
- Martin, Samuel E. 1966. "Lexical evidence relating Korean to Japanese." Language 12.2, 185–251.
- Nichols, Johanna. 1992. Linguistic Diversity in Space and Time. Chicago: University of Chicago Press.
- Robbeets, Martine. 2004. "Belief or argument? The classification of the Japanese language." Eurasia Newsletter 8. Graduate School of Letters, Kyoto University.
- Ruhlen, Merritt. 1987. A Guide to the World's Languages. Stanford University Press.
- Sinor, Denis. 1990. Essays in Comparative Altaic Linguistics. Bloomington: Indiana University, Research Institute for Inner Asian Studies. ISBN 0933070268.
[edit] See also
[edit] External links
- Altaic family tree Ethnologue (Micro-Altaic)
- Monumenta altaica Altaic linguistics website, maintained by Ilya Gruntov
- Altaic Etymological Dictionary, database version by Sergei A. Starostin, Anna V. Dybo, and Oleg A. Mudrak (does not include introductory chapters)
- LINGUIST List 5.911 defense of Altaic by Alexis Manaster Ramer (1994)
- LINGUIST List 5.926 1. Remarks by Alexander Vovin. 2. Clarification by J. Marshall Unger. (1994)
http://www.plosone.org/article/info:doi%2F10.1371%2Fjournal.pone.0004210
The Peopling of Korea Revealed by Analyses of Mitochondrial DNA and Y-Chromosomal Markers
- To add a note, highlight some text. Hide notes
- Make a general comment
1 Department of Biological Sciences, Dankook University, Cheonan, Korea, 2 The Wellcome Trust Sanger Institute, Wellcome Trust Genome Campus, Hinxton, Cambridge, United Kingdom
Abstract Top
Background
The Koreans are generally considered a northeast Asian group because of their geographical location. However, recent findings from Y chromosome studies showed that the Korean population contains lineages from both southern and northern parts of East Asia. To understand the genetic history and relationships of Korea more fully, additional data and analyses are necessary.
Methodology and Results
We analyzed mitochondrial DNA (mtDNA) sequence variation in the hypervariable segments I and II (HVS-I and HVS-II) and haplogroup-specific mutations in coding regions in 445 individuals from seven east Asian populations (Korean, Korean-Chinese, Mongolian, Manchurian, Han (Beijing), Vietnamese and Thais). In addition, published mtDNA haplogroup data (N = 3307), mtDNA HVS-I sequences (N = 2313), Y chromosome haplogroup data (N = 1697) and Y chromosome STR data (N = 2713) were analyzed to elucidate the genetic structure of East Asian populations. All the mtDNA profiles studied here were classified into subsets of haplogroups common in East Asia, with just two exceptions. In general, the Korean mtDNA profiles revealed similarities to other northeastern Asian populations through analysis of individual haplogroup distributions, genetic distances between populations or an analysis of molecular variance, although a minor southern contribution was also suggested. Reanalysis of Y-chromosomal data confirm!ed both the overall similarity to other northeastern populations, and also a larger paternal contribution from southeastern populations.
Conclusion
The present work provides evidence that peopling of Korea can be seen as a complex process, interpreted as an early northern Asian settlement with at least one subsequent male-biased southern-to-northern migration, possibly associated with the spread of rice agriculture.
Citation: Jin H-J, Tyler-Smith C, Kim W (2009) The Peopling of Korea Revealed by Analyses of Mitochondrial DNA and Y-Chromosomal Markers. PLoS ONE 4(1): e4210. doi:10.1371/journal.pone.0004210
Editor: Mark A. Batzer, Louisiana State University, United States of America
Received: September 12, 2008; Accepted: December 8, 2008; Published: January 16, 2009
Copyright: ? 2009 Jin et al. This is an open-access article distributed under the terms of the Creative Commons Attribution License, which permits unrestricted use, distribution, and reproduction in any medium, provided the original author and source are credited.
Funding: This study, which forms a part of the project, has been achieved with the support of Conservation Technology Research and Development project, which has been hosted by National Research Institute of Cultural Heritage of Cultural Heritage Administration, Republic of Korea. This work was supported by grant from the Koguryo Research Foundation, Republic of Korea. CTS was supported by The Wellcome Trust. The funders had no role in study design, data collection and analysis, decision to publish, or preparation of the manuscript.
Competing interests: The authors have declared that no competing interests exist.
* E-mail: wookkim@dankook.ac.kr
Introduction Top
An understanding of the evolutionary history of East Asian populations has long been a subject of interest in the field of human evolutionary genetics. Based on results of classical genetic markers, there is significant separation between southern and northern populations of East Asia [1]. This north-south genetic differentiation is likely to have an origin in the early peopling of the region. There have been two major models for early migration routes into East Asia. The first model postulates a southeast Asian origin, followed by a northward migration [2]. . Recent genetic surveys using autosomal microsatellite markers [3] and Y-chromosomal binary markers [4] have been interpreted as supporting this model. In contrast, the second model suggests a multidirectional route: one migration through central Asia and one through southeast Asia [1], [5], [6]. Thus, understanding the genetic origin and history of Korea may be informative for questions concerning prehistoric migration route(s) and population expansions in East Asia.
The Korean Peninsula is located to the north of the Yellow and Yangtze Rivers of China, and bounded to the northeast by Russia. Therefore, the Koreans are geographically a northeast Asian group. Anthropological and archeological evidence suggests that the early Korean population was related to Mongolian ethnic groups who inhabited the general area of the Altai Mountains and Lake Baikal regions of southeast Siberia [7]. According to Korea's founding myths, the Ancient Chosun (the first state-level society of Korea) was established around 2,333 BC in the region of southern Manchuria but later moved into the Pyongyang area of northwest Korea. In addition, archeological evidence reveals that rice cultivation had spread to most parts of the Korean Peninsula by around 1,000?2,000 BC, introduced from the Yellow River and/or Yangtze River basin in China [8].
Studies of classical genetic markers showed that Koreans tend to have a close genetic affinity with Mongolians among East Asians [9]?[11]. In contrast, recent surveys of Y-chromosomal DNA variation revealed that the Korean population contained lineages typical of both southern and northern East Asian populations [6], [12], [13]. The Koreans appeared to have affinities with Manchurians, Yunnan-Chinese from southern China, and Vietnamese [13].
To understand the genetic history of Korea better, more data from additional genetic markers from Korea and its surrounding regions are necessary. Mitochondrial DNA (mtDNA), like the Y chromosome, can also provide valuable information about the phylogeography of human populations due to its special features of haploidy and uniparental inheritance [14]?[18]. Although recent investigations of mtDNA variation in East Asia have provided valuable information for constructing a robust phylogenetic tree of mtDNA haplotypes, limited data on the Korean population are available [19]?[21].
In this study, we present new data on the mtDNA sequence variation of the hypervariable segments I and II (HVS-I and HVS-II) and haplogroup-specific mutations in coding regions in 445 individuals from seven East Asian populations, including Korea. In addition, mtDNA haplogroup data (N = 3307), mtDNA HVS-I sequences (N = 2313), Y chromosome haplogroup data (N = 1697) and Y chromosome STR data (N = 2713) from the literature were analyzed to elucidate wider aspects of the genetic structure of East Asian populations.
Materials and Methods Top
DNA samples and reference data
We analyzed a total of 445 individuals, collected from seven East Asian populations (Korean, Korean-Chinese (People of Korean origin now living in China), Mongolian, Manchurian, Chinese Han (Beijing), Vietnamese, and Thai). The DNA samples included subsets of the samples examined by Jin et al. [13] and Kwak et al. [22], although the exact number of subjects for each population occasionally varies between these studies. In addition, we included the following new Korean-Chinese and Mongolian samples: 51 Korean-Chinese from northern China and 47 Mongolians from Ulaanbaatar. This study was approved by the Ethics Committee and institutional review boards of Institute of Bio-Science and Technology in the Dankook University in Cheonan, and separate written informed consent was obtained for enrollment from all participants. DNA was prepared from whole blood by the standard method [23] or was extracted from buccal cells according to the procedure of Richards et al. [24].
In addition to our mtDNA data sets, mtDNA haplogroup data for 2862 individuals, mtDNA HVS-I sequences data for 1868 individuals, Y chromosome haplogroup data for 1697 individuals and Y chromosome STR data (ten Y-STR loci: DYS19, DYS389I, DYS389b, DYS390, DYS391, DYS392, DYS393, DYS437, DYS438 and DYS439) for 2716 individuals were retrieved from the literature [19], [20], [25]?[40] to elucidate the genetic relationship between Koreans and other East Asian populations (details in Supplementary Table S1 and Figure 1). For mtDNA haplogroup analysis, some sub-haplogroups were clustered into major haplogroups according to their phylogenetic affiliations (Supplementary Table S2). Similarly, Y chromosome haplogroups from reference data were reclassified into a common set of 13 Y-chromosomal (sub)haplogroups that captured most of the phylogenetic information to allow population comparisons (Supplementary Table S3).
Figure 1. Geographic locations of the Asian populations studied.
(A) mtDNA haplogroups. (B) mtDNA HVS-I sequences. (C) Y-chromosome haplogroups. (D) Y-chromosome STRs. aWen et al. [27]. bLi et al. [36].
doi:10.1371/journal.pone.0004210.g001PCR amplification
PCR amplification of the HVS-I and HVS-II of mtDNA control region was performed using two primer sets as described by Yao et al. [19]: HVS-I, L15996/H16498 (nucleotide positions, 15975-15996/16517-16498); HVS-II, L29/H408 (nucleotide positions, 8-29/429-408). Primers were designed for amplifying multiple fragments that contain haplogroup diagnostic polymorphisms in the coding regions [19], [20], [41]. Each set of segments was amplified in a 50 ul reaction containing 25 ng of genomic DNA, 10 pM of each primer, 0.2 mM of dNTPs, 2.0 mM MgCl2, 5 mM KCl, 10 mM TRIS-HCl (pH 8.3) and 1.5 U AmpliTaq DNA polymerase (Perkin-Elmer, CA, USA). The PCR amplification was carried out using a GeneAmp? PCR system 9700 thermal cycler (Applied Biosystems, CA, USA) under the conditions described in Table 1.
Table 1. Primers for mtDNA amplification, sequencing and RFLP analyses.
doi:10.1371/journal.pone.0004210.t001mtDNA sequencing and genotyping of RFLP
After PCR amplification, each PCR product was purified using the Wizard? PCR Preps DNA Purification System (Promega, WI, USA) and then sequenced by cycle sequencing using either a MegaBase 1000 sequencer (Amersham Bioscience, USA) or an ABI PRISM™ 310 Genetic Analyzer (Applied Biosystems, CA, USA) with DYEnamic ET Dye Terminator (Amersham Bioscience, USA) or BigDye™ Terminator (PE Biosystems, USA), respectively. DNA sequences of the PCR amplicons were determined from both forward and reverse sequence data using the original primer pairs. The sequences from nucleotide position (np) 16024 to 16365 in HVS-I and from 73 to 340 in HVS-II were determined, since ambiguous electropherograms for 20?30 nucleotides near the primers were frequently observed.
The intergenic COII/tRNALys 9-bp deletion was analyzed as described in Jin et al. [42]. In addition, several amplified segments, mainly in the mtDNA coding regions, were analyzed by RFLP typing and additional sequencing, as listed in Table 1.
Sequence alignment and haplogroup analyses
Sequences were aligned and compared with the revised Cambridge Reference Sequence (rCRS) [43] using the Sequencher program ver. 2000 (Gene Codes corporation, MI, USA). The results were converted into a Microsoft Excel table (Microsoft Corporation, CA, USA). The mtDNAs were classified into the (sub-)haplogroups based on HVS-I/II motifs of haplogroup specific-sequences as well as coding regions as described in recent surveys [19], [20], [25], [44], [45]. The HVS-I motif searching and haplogroup-directed comparison with closely related sequences from other databases led us to tentatively assign each mtDNA to a haplogroup. To further characterize the mtDNA lineage tested, we compared their HVS-II motif to verify the predicted haplogroup status of each mtDNA. In general, more than 95% of mtDNA lineages can faithfully be classified to specific haplogroups using HVS-I/II motifs without extra information from coding region sequences [44]. However, in the remaining cases, their (sub-)haplogroups were characterized using sequence information from some coding region sites (Table 1). After each mtDNA was assigned to the most-derived named haplogroup, the haplogroup distribution frequencies in each of seven populations were estimated. For quality assurance purposes, we performed quasi-median network analysis [46], [47]. The HVS-I (np 16024?16365 np) and HVS-II (np 74?340) sequence of 445 individuals of this study have been submitted to GenBank (Accession Numbers, FJ493775-FJ494664).
Data analyses
The genetic differentiation between different population samples and its statistical significance were assessed via FST (mtDNA HG and HVS-I/II and Y-SNPs) and RST (Y-STRs) values. The population genetic structure of the ethnic and/or regional groups was analyzed through the analysis of molecular variance (AMOVA) approach [48]. The calculations of diversity indices, FST, RST and AMOVA were performed using the Arlequin 2.000 package [49]. Population pairwise FST and RST values were visualized by multidimensional scaling (MDS) plot analyses using SPSS 12.0 software.
Haplogroup-specific median-joining networks [50] for Y chromosome data were constructed using the NETWORK 4.2 program (www.fluxus-technology.com). Such networks were initially highly reticulated, and we reduced reticulations by first weighting the loci according to the inverse of their variance in the dataset used [51] and subsequently constructing a reduced-median network [52] to form the input of the median-joining network [53].
The admixture proportions of northeast Asian and the southeast Asian parental populations in the Korean population were estimated for mtDNA and the Y chromosome using the Admix 2.0 software [54]
Results and Discussion Top
Almost all of the mtDNA lineages analyzed here could be assigned to the East Asian-specific (sub)haplogroups described recently [19], [20], [25], [44], [45], with the exception of two individuals belonging to the European mtDNA haplogroups T (Manchurian) and U5a (Mongolian) (Table 2). The gene diversity (H), nucleotide diversity (πn), and mean number of pairwise differences of the population samples are listed in Table 3. All seven populations displayed high levels of genetic diversity (H>0.99), suggesting a relatively large population size and heterogeneity of each mtDNA pool. The haplogroup frequencies observed in each population are summarized in Table 2. Based on these haplogroup assignments, the Koreans share lineages with both the southern and the northern haplogroup complexes of East Asia. We first attempted to quantitate these contributions by a detailed consideration of the distribution of each lineage.
Table 2. Distribution of mtDNA haplogroup frequencies in 7 East Asian populations.
doi:10.1371/journal.pone.0004210.t002Table 3. Diversity indices of mtDNA in seven east Asian populations.
doi:10.1371/journal.pone.0004210.t003The highest (23.8%) frequency in the Korean mtDNA pool was observed for haplogroup D4, which is widespread in northern East Asia and especially in the Korean-Chinese (21.6%), and Manchurians (20.0%). In total, haplogroup D lineages including the subhaplogroups (D4, D4a, D4b, D5, and D5a) accounted for 32.4% of the Korean mtDNA pool. In addition, the Koreans present moderate frequencies of (sub)haplogroup A (8.1%) and (sub)haplogroup G (10.3%) lineages, mostly preval!ent in northeast Asia and southeast Siberia [20], [55]?[57]. Other Siberian and Mongolian-preval!ent haplogroups from the C, Y and Z lineages make up less than 4% of the Korean mtDNA pool. Haplogroups A5a and Y2 are found almost exclusively in Korea but were present at extremely low frequencies. In total, these northern haplogroups account for ~60% of the mtDNA gene pool of the Koreans. In addition, southeast Asian-preval!ent mtDNA lineages of (sub)haplogroups B (14.6%), M7 (10.3%), and F (9.7) are also found at moderate frequencies in the Korean population (Table 2). These findings suggest that more than 30% of the Korean mtDNA pool is attributable to maternal lineages with a more southern origin. We also found the haplogroup M7a1 exclusively in the Korean population. This result is consistent with previous reports that haplogroup M7a is restricted to Japan and south Korea [18], [20]. Thus, the distribution pattern of mtDNA haplogroups leads us to consider that the peopling of Korea is likely to have involved multiple sources.
We then investigated the mtDNA and Y-chromosomal relationships between the East Asian populations, using both the new and published data. In these analyses mtDNA haplogroups, mtDNA HVS-I sequences, Y-SNPs and Y-STRs were compared (Supplementary Tables S1, S2, S3). Pairwise FST (mtDNA haplogroup, mtDNA HVS-I sequences and Y-SNPs) and RST (Y-STRs) values between East Asian populations were calculated (Supplementary Table S1). The FST distances of mtDNA markers (mtDNA haplogroups and HVR-I sequences) of Korean populations showed close relationships with Manchurians, Japanese, Mongolians and northern Han Chinese but not with southern Asians (Supplementary Tables S4 and S5; Figure 2A, B). In the MDS plots, the Korean samples lay entirely within the cluster of northern populations.
Figure 2. Multidimensional scaling (MDS) plot based on (A) FST distances of mtDNA haplogroups (stress = 0.21).
(B) FST distances of mtDNA HVS-I sequences (stress = 0.19). (C) FST distances of Y chromosome haplogroups (stress = 0.21). (D) RST distances of Y chromosome STRs (stress = 0.19). (closed diamond: North Asians; opened diamonds: South Asians). aWen et al. [27]. bLi et al. [36].
doi:10.1371/journal.pone.0004210.g002In contrast, the results of Y chromosome analyses (based on Y-SNPs and Y-STRs) of Korean populations revealed closer relationships with both northeast and southeast Asian populations (Supplementary Tables S6 and S7; Figure 2C, D). Like the mtDNA distances, Y-chromosomal distances from Manchurian, Japanese and northern Han Chinese populations were usually not significantly greater than zero, but some distances from southern Han populations (e.g. Yunnan Han, Y haplogroups; Meixian Han, Y-STRs) or other southern populations (e.g. Vietnamese, Y haplogroups) were also not significantly above zero (Supplementary Tables S6 and S7), as noted previously [13]. In the MDS plots, the Korean samples lay at the border between the northern and southern clusters, rather than within the northern cluster (Figure 2C, D). In order to investigate Y-chromosomal relationships in more detail, we visualized STR haplotypes within a common predominantly northern haplogroup (C*) and southern haplogroup (O3) using networks [50] constructed with the seven Y-STRs common to all datasets (Figure 3). These networks did not show striking geographical structure, so we calculated, for each Korean haplotype, the distance to the closest northern and southern haplotype. In both haplogroups, the mean distance to the southern haplotypes was lower than to the northern haplotypes (C* Korean-north 5.0 steps, Korean-south 4.5 steps; O3 Korean-north 3.5 steps, Korean-south 2.2 steps). This finding is particularly striking for haplogroup C* because it is far more preval!ent in the north (Figure 3A).
Figure 3. Median-joining network for east Asian (A) Network of 7 Y-STRs (DYS19, DYS389b, DYS389I, DYS390, DYS391, DYS392 and DYS393) variation within Haplogroup C.
(B) Network of 7 Y-STRs within Haplogroup O3. Circle areas are proportional to haplotype frequency. Lines represent the mutational differences between haplotypes. The network corresponds the following colors: purple- far north Asian populations (Daur, Ewenki, Han (Xinjiang), inner Mongolians, Oroqen, outer Mongolians, Uygur (Yili), Uygur (Urumqi) and Xibe); blue- Koreans; white-far south Asian populations (Buyi, Han (Guangdong), Han (Sichuan), Han (Yunnan), Hani, Indonesians, Li, philippines, She, Thais, Vietnamese, Yao (Bama) and Yao (Liannan).
doi:10.1371/journal.pone.0004210.g003The genetic differences between the Koreans and other East Asians were examined by AMOVA (Table 4). When samples were grouped into northeast Asians and southeast Asians (excluding Koreans), a highly significant difference was found between the two groups with all markers. Thus there is significant genetic differentiation within the region, and we could then compare each group separately with the Koreans. With mtDNA, Koreans were not significantly different from either group when HVRI sequences were compared, although they were distinct from the southeast Asians in the haplogroup comparisons. With the Y chromosomes, they were again not distinct from either group when haplogroup comparisons were made, but were distinct from the southeast Asians in the STR-based comparison (Table 4).
Our study documents the genetic relationships of the Koreans with their neighboring populations in unprecedented detail. Two major findings emerge. First, the Koreans are overall more similar to northeast Asians than to southeast Asians. This conclusion would be expected from the general correlation between genetic variation and geography observed for human populations, and is supported here by an examination of individual mtDNA haplogroups (Table 2), genetic distances between populations derived from mtDNA or Y-chromosomal data (Figure 2), and the apportionment of genetic diversity between different groups of populations (Table 4). Second, the conclusions from mtDNA and Y-chromosomal analyses differ. Sex-biased admixture is common in human expansions such as that of Bantu-speaking farmers in Africa [58], the spread of the Han ethnic group in China [59] or the post-Columbian peopling of the Americas [60]. The effects in Korea are more subtle, but show a larger male than female contribution from southern East Asia to the population of Korea, most clearly revealed by the admixture estimates, where a 35% contribution from the south was estimated for mtDNA, compared with a 83% contribution for the Y chromosome (Table 5).
Table 5. Admixture estimates of Northeast Asians and Southeast Asians in Korean populations.
doi:10.1371/journal.pone.0004210.t005The predominant genetic relationship with northern East Asians is consistent with other lines of evidence. Xue et al. [31] reported that the northern East Asian populations started to expand in number before the last glacial maximum at 21-18 KYA, while the southern populations all started to expand after it, but then grew faster, and they suggested that the northern populations expanded earlier because they could exploit the abundant megafauna of the “Mammoth Steppe,” while the southern populations could increase in number only when a warmer and more stable climate led to more plentiful plant resources such as tubers. By this criterion, the Koreans, expanding at about 30 KYA [31] also resemble other northern populations. Historical evidence suggests that the Ancient Chosun, the first state-level society, was established in the region of southern Manchuria and later moved into the Pyongyang area of the northwestern Korean Peninsula. Based on archeological and anthropological data, the early Korean population possibly had an origin in the northern regions of the Altai-Sayan and Baikal regions of Southeast Siberia [7], [8], [61].
What could be the origin of the male-biased southern contribution to Korean gene pool illustrated, for example, by haplogroups O-M122 (42.2%) and O-SRY465 (20.1%) [29]. Recent molecular genetic analyses and the geographical distribution of haplogroup O-M122 lineages, found widely throughout East Asia at high frequencies (especially in southern populations and China), have suggested a link between these Y-chromosome expansions and the spread of rice agriculture in East Asia [62]?[64]. In general, Y-chromosomes might be spread via a process of demic diffusion during the early agricultural expansion period [65], [66]. If this interpretation were substantiated, the spatial pattern of Y-haplogroup O would imply a genetic contribution to Korea through the spread of male-mediated agriculture. Large-scale genetic analyses thus begin to reveal some of the complexities of the peopling of Korea, and further studies of individual autosomal loci or genomewide genotyping and sequencing are expected to provide further insights.
Supporting Information Top
Asian populations studied
(0.05 MB XLS)


mtDNA-haplogroup distributions in East Asian populations
(0.05 MB XLS)
Y-haplogroup distribution in East Asian populations
(0.03 MB XLS)

FST distances of mtDNA haplogroups in east Asian populations (non-significant values are underlined). aPresent work; bKivisild et al. [20]; cYao et al. [19]; dLee et al. [30]; eWen et al. [27]; fKong et al. [25]; gLi et al. [36].
(0.22 MB XLS)
FST values of mtDNA HVR-I Sequences in east Asian populations (non-significant values are underlined). aPresent work; bMaruyama et al. [26]; cKivisild et al. [20]; dKong et al. [25]; eYao et al. [19]; fZhang et al. [28]; gLi et al. [36]; hPowell et al. [37]
(0.07 MB XLS)
FST distances of Y chromosome haplogroups in east Asian popoulations (non-significant values are underlined). aHong et al. [29]; bXue et al. [31].
(0.05 MB XLS)
RST distances in east Asian populations using ten Y chromsome STRs (non-significant values are underlined). aHara et al. [34]; bHuang et al. [40]; cHwang et al. [35]; dYan et al. [38]; eZhang et al. [33]; fZhang et al. [39]; gYong et al. [32]; hXue et al. [31].
(0.05 MB XLS)
Acknowledgments Top
We would like to thank H.J. Bandelt for crucial comments and advice on the mtDNA study. We are grateful to all volunteers for providing DNA samples. We also thank K.D. Kwak and S.B. Hong for technical assistance.
Author Contributions
Conceived and designed the experiments: HJJ CTS WK. Performed the experiments: HJJ. Analyzed the data: HJJ CTS WK. Contributed reagents/materials/analysis tools: WK. Wrote the paper: HJJ CTS WK.
References Top
- (1994) The History and Geography of Human Genes. Princeton: Princeton University Press.
- (1990) Major features of sundadonty and sinodonty, including suggestions about east Asian microevolution, population history and late Pleistocene relationships with Australian aboriginals. Am J Phys Anthropol 82: 295?317. Find this article online
- (1998) Genetic relationship of populations in China. Proc Natl Acad Sci USA 95: 11763?11768. Find this article online
- (1999) Y-chromosome evidence for a northward migration of modern humans into eastern Asia during the last Ice Age. Am J Hum Genet 65: 1718?1724. Find this article online
- (1993) Evolutionary relationships of human populations on a global scale. Mol Biol Evol 10: 927?943. Find this article online
- (2001) Paternal population history of east Asia: sources, patterns, and microevolutionary processes. Am J Hum Genet 69: 615?628. Find this article online
- (1970) People and language. Korea - Its People and Cultures. Seoul: Hakwon-sa Ltd.
- (2001) Korean archaeology for the 21st century: from prehistory to State formation. Seoul J Kor Studies 14: 117?147. Find this article online
- (1987) Red cell and serum protein polymorphisms in three population groups of south Korea. Gene Geogr 1: 177?188. Find this article online
- (1992) Origin of the Koreans: a population genetic study. Am J Phys Anthropol 88: 27?36. Find this article online
- (1993) Frequency distribution of alleles at D1S80 and apo-B 3′ VNTR loci in Korean population. Mol Cells 3: 457?453. Find this article online
- (2000) Y chromosomal DNA variation in East Asian populations and its potential for inferring the peopling of Korea. J Hum Genet 45: 76?83. Find this article online
- (2003) Y-chromosomal DNA haplogroups and their implications for the dual origins of the Koreans. Hum Genet 114: 27?35. Find this article online
- (1980) Maternal inheritance of human mitochondrial DNA. Proc Natl Acad Sci U S A 77: 6715?6719. Find this article online
- (1999) Mitochondrial DNA variation in human evolution and disease. Gene 238: 211?230. Find this article online
- (2003) The application of molecular genetic approaches to the study of human evolution. Nat Get 33: 266?275. Find this article online
- (2003) The human Y chromosome: an evolutionary marker comes of age. Nat Rev Genet 4: 598?612. Find this article online
- (2007) Use of Y chromosome and mitochondrial DNA population structure in tracing human migrations. Annu Rev Genet 41: 539?564. Find this article online
- (2002) Phylogeographic differentiation of mitochondrial DNA in Han Chinese. Am J Hum Genet 70: 635?651. Find this article online
- (2002) The emerging limbs and twigs of the East Asian mtDNA tree. Mol Biol Evol 19: 1737?1751. Find this article online
- (2004) Mitochondrial genome variation in eastern Asia and the peopling of Japan. Genome Res 14: 1832?1850. Find this article online
- (2005) Y-chromosomal STR haplotypes and their applications to forensic and population studies in east Asia. Int J Legal Med 119: 195?201. Find this article online
- (1989) Molecular Cloning: a Laboratory Manual, 2nd edn. New York: Cold Spring Harbor Laboratory Press.
- (1993) Multiplex PCR amplification from the CFTR gene using DNA prepared from buccal brushes/swabs. Hum Mol Genet 2: 159?163. Find this article online
- (2003) Mitochondrial DNA sequence polymorphisms of five ethnic populations from northern China. Hum Genet 113: 391?405. Find this article online
- (2003) Sequence polymorphisms of the mitochondrial DNA control region and phylogenetic analysis of mtDNA lineages in the Japanese population. Int J Legal Med 117: 218?225. Find this article online
- (2005) Genetic structure of Hmong-Mien speaking populations in East Asia as revealed by mtDNA lineages. Mol Biol Evol 22: 725?734. Find this article online
- (2005) Haplotype diversity in mitochondrial DNA hypervariable region I, II and III in northeast China Han. Forensic Sci Int 149: 267?269. Find this article online
- (2006) Y-chromosome Haplogroup O3-M122 Variation in East Asia and Implications for the Peopling of Korea. Korean J Genetics 28: 1?8. Find this article online
- (2006) Mitochondrial DNA control region sequences in Koreans: identification of useful variable sites and phylogenetic analysis for mtDNA data quality control. Int J Legal Med 120: 5?14. Find this article online
- (2006) Male demography in East Asia: a north-south contrast in human population expansion times. Genetics 172: 2431?2439. Find this article online
- (2006) Y-chromosome STR haplotype diversity in three ethnic populations in Singapore. Forensic Sci Int 159: 244?257. Find this article online
- (2006) Genetic polymorphisms of 17 Y-STRs haplotypes in Tibetan ethnic minority group of China. Leg Med (Tokyo) 8: 300?305. Find this article online
- (2007) Genetic data for 16 Y-chromosomal STR loci in Japanese. Leg Med (Tokyo) 9: 161?170. Find this article online
- (2007) Haplotypes for 12 Y-chromosomal STR loci in a Korean population (the central region). Forensic Sci Int 168: 73?84. Find this article online
- (2007) Mitochondrial DNA diversity and population differentiation in southern East Asia. Am J Phys Anthropol 134: 481?488. Find this article online
- (2007) The population history of the Xibe in northern China: a comparison of autosomal, mtDNA and Y-chromosomal analyses of migration and gene flow. FSI Genetics 1: 115?119. Find this article online
- (2007) Genetic polymorphisms of 17 Y-STRs haplotypes in Chinese Han population residing in Shandong province of China. Leg Med (Tokyo) 9: 196?202. Find this article online
- (2007) Population genetics for Y-chromosomal STRs haplotypes of Chinese Korean ethnic group in northeastern China. Forensic Sci Int 173: 197?203. Find this article online
- (2008) Polymorphism of 17 Y-STR loci in Taiwan population. Forensic Sci Int 174: 249?254. Find this article online
- (2003) Diversity of mitochondrial DNA lineages in South Siberia. Ann Hum Genet 67: 391?411. Find this article online
- (1999) Distribution of length variation of the mtDNA 9-bp motif in the intergenic COII/tRNALys region in East Asian populations. Korean J Biol Sci 3: 393?397. Find this article online
- (1999) Reanalysis and revision of the Cambridge reference sequence for human mitochondrial DNA. Nat Genet 23: 147. Find this article online
- (2004) Different matrilineal contributions to genetic structure of ethnic groups in the silk road region in China. Mol Biol Evol 21: 2265?2280. Find this article online
- (2006) Harvesting the fruit of the human mtDNA tree. Trends Genet 22: 339?345. Find this article online
- (2002) The fingerprint of phantom mutations in mitochondrial DNA data. Am J Hum Genet 71: 1150?1160. Find this article online
- (2006) Application of a quasi-median network analysis for the visualization of character conflicts to a population sample of mitochondrial DNA control region sequences from southern Germany (Ulm). Int J Legal Med 120: 310?314. Find this article online
- (1992) Analysis of molecular variance inferred from metric distances among DNA haplotypes: application to human mitochondrial DNA restriction data. Genetics 131: 479?491. Find this article online
- (2000) Arlequin: a softwere for population genetics data analysis, Ver. 2.000, Genetics and Biometry Lab, Department of Anthropology, University of Geneva.
- (1999) Median-joining networks for inferring intraspecific phylogenies. Mol Biol Evol 16: 37?48. Find this article online
- (2002) Y-chromosomal DNA variation in Pakistan. Am J Hum Genet 70: 1107?1124. Find this article online
- (1995) Mitochondrial portraits of human populations using median networks. Genetics 141: 743?753. Find this article online
- (2008) Y-chromosomal diversity in Lebanon is structured by recent historical events. Am J Hum Genet 82: 873?882. Find this article online
- (2001) Inferring admixture proportions from molecular data: expansion to any number of parental populations. Mol Biol Evol 18: 672?675. Find this article online
- (2002) Genetic relationship of Chinese ethnic populations revealed by mtDNA sequence diversity. Am J Phys Anthropol 118: 63?76. Find this article online
- (2004) Restriction polymorphism of mitochondrial DNA in Koreans and Mongoilians. Russian J Genet 40: 1562?1570. Find this article online
- (2005) Mitochondrial DNA diversity in indigenous populations of the southern extent of Siberia, and the origins of Native American haplogroups. Ann Hum Genet 69: 67?89. Find this article online
- (2008) Maternal traces of deep common ancestry and asymmetric gene flow between Pygmy hunter-gatherers and Bantu-speaking farmers. Proc Natl Acad Sci U S A 105: 1596?1601. Find this article online
- (2004) Genetic evidence supports demic diffusion of Han culture. Nature 431: 302?305. Find this article online
- (2007) Pre- and post-Columbian gene and cultural continuity: the case of the Gaucho from southern Brazil. Hum Hered 64: 160?171. Find this article online
- (1995) Altai and the Korean Peninsula from the Perspective of Archaeological Remains. Seoul: Korea National Museum.
- (2002) The Journey of Man: A Genetic Odyssey. Princeton: Princeton University Press.
- (2003) Inferring human history: clues from Y-chromosome haplotypes. Cold Spring Harb Symp Quant Biol 68: 487?493. Find this article online
- (2005) Y-chromosome evidence of southern origin of the East Asian-specific haplogroup O3-M122. Am J Hum Genet 77: 408?419. Find this article online
- (2006) Dual origins of the Japanese: common ground for hunter-gatherer and farmer Y chromosomes. J Hum Genet 51: 47?58. Find this article online
- (1998) Spatial genetic structure of human populations in Japan. Hum Biol 70: 1?22. Find this article online
http://www.africaresource.com/rasta/sesostris-the-great-the-egyptian-hercules/african-roots-of-china/
African Roots Of China
Africans launched Chinese civilisation
By Nsaka Sesepkekiu
Student of African and Asian Studies
Faculty of Humanities
University of the West Indies
Trinidad and Tobago
Whenever we hear the term “Chinese” we often associate the word with short slanted eyed people who can fight kung fu. With the recent celebration of establishment of the People’s Republic of China, I wish not only to congratulate them but also to add some insight into their history.
The original, first, native, primitive inhabitants of China were black Africans who arrived there about 100,000 years ago and dominated the region until a few thousand years ago when the Mongol advance into that region began. These Africans who fled the Mongol onslaught can still be found in South East Asia and the Pacific Islands misnomered Nigritos or “small black men.” The Agta of the Philippines is one such example. Indeed archeology, forensic and otherwise confirm that China’s first two dynasties, the Xia and the Ch’ang/Sh’ang, were largely Black African with an Australoid, called “Madras Indian” or “Chamar” in Trinidad, present in small percentages. These Africans would carry an art of fighting developed in the Horn of Africa into China which today we call martial arts: Tai Chi, Kung fu and Tae Kwon Do. Even the oracle of the I-Ching came with a later African group, the Akkadians of Babylon.
Around 500 BCE an African living in India called Gautama would establish a religion called Buddhism which would come to dominate Chinese thought. Any one who is in doubt should consult Geoffrey Higgins’s Anacalypsis, Albert Churchward’s Origin and development of Religions, Gerald Massey’s Egypt the Light of the World, Riunoko Rashidi’s African Presence in Early Asia and J A Roger’s Sex and Race Vol 1. Many Africans survived the Mongol invasion into the twentieth century only to be exterminated by Chairman Mao’s programme of Cultural cleansing. Under this programme millions of Africans and Afro-Asians were killed from 1951-1956. Contribute we still did, giving the People’s Republic of China its first Chief Minister in the name of Eugene Chen, a Trinidadian of George Street, Port-of-Spain, who was of an African mother and a Chinese father.
For further reading on this individual one should consult J A Rogers’ World’s Great Men of Colour Vol I. So next time the word China or Chinese is mentioned remember that Africans played a pivotal role in launching what is called Chinese civilisation, if such a thing exists.
Â
http://www.raceandhistory.com/
Â
You are reading Rasta Livewire. For all things Africa, visit AfricaResource: The Place for Africa on the Net.
Related Posts:
- Ancient Black Chinese From East Africa -- (by Prof Jin Li)
- The Black African Foundation of China: The First Chinese
- Africa/China Co-operation: 50 Year Review
- Nigerian Satellite launched by China
- China To Build Nigerian Railway
- The Forgotten People:The African Origin Of China Part 1 - By: Lauren K. Clark
- Africa Makes A Splash in Beijing
- Human Diversity: Pale Skin/Black Genes
- The Black African Foundation of China -- Honouring The Aboriginal Black People of China
The Black African Foundation of China: The First Chinese
The First Chinese
By Dr. Clyde Winters
Edited by Ogu-Eji-Ofo-Annu
It can be reasonably assumed that the first inhabitants of the chinese mainland were Black Brown Africans from East, West and Central regions of Africa given that the earliest human skeletal remains in China are of “Negro” (or “Negritosâ€� a psuedo-scientific term commonly used today) people. The next oldest skeletal type after the period of predominance of the African immigrants were the Classical Mongoloids or Austronesian speakers.
Archaeological research makes it clear that “Negroids” (read: Central African skeletal types) were very common to ancient China. F. Weidenreich in Bull. Nat. Hist. Soc. Peiping 13, (1938-30) noted that the one of the earliest skulls from north China found in the Upper Cave of Chou-k’ou-tien, was of a Oceanic Negroid/ Melanesoid ” (p.163). This is the so-called Peking Man. This would place people in China during the Mesolithic looking like African/Negro people , not native American.
These Blacks were the dominant group in South China. Kwang-chih Chang, writing in the 4th edition of Archaeology of ancient China (1986) wrote that:” by the beginning of the Recent (Holocene) period the population in North China and that in the southwest and in Indochina had become sufficiently differentiated to be designated as Mongoloid and OCEANIC NEGROID races respectively….”(p.64). By the Upper Pleistocene the Negroid type was typified by the Liu-chiang skulls from Yunnan (Chang, 1986, p.69).
Negroid skeletons dating to the early periods of Southern Chinese history have been found in Shangdong, Jiantung, Sichuan, Yunnan, Pearl River delta and Jiangxi especially at the initial sites of Chingliengang (Ch’ing-lien-kang) and Mazhiabang (Ma chia-pang) phases (see: K.C. Chang, The archaeology of ancient China, (Yale University Press:New Haven,1977) p.76) . The Chingliengang culture is often referred to as the Ta-wen-k’ou (Dawenkou) culture of North China. The presence of Negroid skeletal remains at Dawenkou sites make it clear that Negroes spread out from the North to South China. The Dawenkou culture predates the Lung-shan culture which is associated with the Xia civilization.
Many researchers believe that the Yi of Southern China were the ancestors of the Austronesian, Polynesian and Melanesian people.
In the Chinese literature the Blacks were called li-min, Kunlung, Ch’iang (Qiang), Yi and Yueh. The founders of the Xia Dynasty and the Shang Dynasties were blacks. These blacks were called Yueh and Qiang. The modern Chinese are descendants of the Zhou. The second Shang Dynasty (situated at Anyang) was founded by the Yin. As a result this dynasty is called Shang-Yin.
The Yin or Classical/Oceanic Mongoloid type is associated with the Austronesian speakers ( Kwang-chih Chang, “Prehistoric and early historic culture horizons and traditions in South China”, Current Anthropology, 5 (1964) pp.359-375 :375). Djehuti your Austronesian or Oceanic ancestors were referred to in the Chinese literature as Yin, Feng, Yen, Zhiu Yi and Lun Yi.
It is not clear that contemporary European and Chinese people are descendants of the original Black population which lived in Europe and Asia; neither is it clear that the Chinese are descendants of the Austronesian speaking people.
Textual evidence and the skeletal record seem to indicate that contemporary Chinese and European people come out of nowhere after 1500 BC, the European Sea People came from the North and attacked Egypt, and the Chinese (Hua) people came from the North and ran the Black Qiang and Yueh tribes, along with the Austronesian Yin (classical mongoloid or Austronesian speakers) off the Chinese mainland back into Southeast Asia or on to the Pacific Islands.
You are reading Rasta Livewire. For all things Africa, visit AfricaResource: The Place for Africa on the Net.
Related Posts:
- Ancient Black Chinese From East Africa -- (by Prof Jin Li)
- Africa/China Co-operation: 50 Year Review
- African Roots Of China
- The Forgotten People:The African Origin Of China Part 1 - By: Lauren K. Clark
- China To Build Nigerian Railway
- Africa Makes A Splash in Beijing
- Nigerian Satellite launched by China
- The Original African Americans - per: New York Times 1922
- The Black African Foundation of China -- Honouring The Aboriginal Black People of China
- The Roots of Afro-Europe: Y-DNA Haplogroup R1b1*, Cro-magnons, and Afro-Europeans - Dana Marniche
The Black African Foundation of China — Honouring The Aboriginal Black People of China
Published on TaipeiTimes
http://www.taipeitimes.com/News/feat/archives/2004/11/27/2003212815
In honor of the Little Black People
The Saisiyat tribe of Hsinchu and Miaoli will perform a solemn rite this weekend to commemorate a race of people that they exterminated
By Jules Quartly
STAFF REPORTER
Saturday, Nov 27, 2004,Page 16
Xiangtian Lake is one of two places to see the ritual. Drinking, singing and dancing are expected to take place deep in the mountains of Miaoli and Hsinchu when the “Ritual of the Little Black People” is performed by the Saisiyat tribe once again this weekend.
For the past 100 years or so, the Saisiyat tribe has performed the songs and rites of the festival to bring good harvests, ward off bad luck and keep alive the spirit of a race of people who are said to have preceded all others in Taiwan.
In fact, the short, black men the festival celebrates are one of the most ancient types of modern humans on this planet and their kin still survive in Asia today. They are said to be diminutive Africoids and are variously called Pygmies, Negritos and Aeta. They are found in the Philippines, northern Malaysia, Thailand, Sumatra in Indonesia and other places.
Chinese historians called them “black dwarfs” in the Three Kingdoms period (AD 220 to AD 280) and they were still to be found in China during the Qing dynasty (1644 to 1911). In Taiwan they were called the “Little Black People” and, apart from being diminutive, they were also said to be broad-nosed and dark-skinned with curly hair.
After the Little Black People — and well before waves of Han migrations after 1600 — came the Aboriginal tribes, who are part of the Austronesian race. They are thought to have come from the Malay Archipelago 6,000 years ago at the earliest and around 1,000 years ago at the latest, though theories on Aborigine migration to Taiwan are still hotly debated. Gradually the Little Black People became scarcer, until a point about 100 years ago, when there was just a small group living near the Saisiyat tribe. The story goes that the Little Black People taught the Saisiyat to farm by providing seeds and they used to party together.
“Tribal disputes later lead to warfare”. The Saisiyat killed off by the little Black People over time. Just two Little Black People survived. Before departing eastward, they taught the Saisiyat about their culture and passed down some of their songs, saying if they did not remember their people they would be cursed and their crops would fail.
The Saisiyat kept their promise and have held the Ritual of the Little Black People every year, though they scaled down the ceremonies during the Japanese colonial period (1895 to 1945). Now the ritual is held every two years on the 10th full moon of the lunar calendar, with a big festival once every 10 years. At this time, the Saisiyat are not supposed to fight and they congregate in their ancestral areas of Miaoli and Hsinchu, in the mountains.
“I’ve seen it written of as a celebration, but to me it seemed quite a mournful affair, especially in the way the music came across, which was trancelike, a haunting kind of chant with a series of 10 to 15 songs,” said long-term Taiwan resident Lynn Miles, who has been to the ritual three times and will be going again this year.
“There’s nothing else quite like it in its tone and in its mood. I’ve been to other festivals but this is non-stop.”
Miles said the dances were not set pieces but usually involved holding hands and moving around in a circle, chanting, with those who know the songs doing most of the singing and a shaman figure keeping order.
A spokeswoman at the Council of Indigenous Peoples (under the Executive Yuan) said that those who have “unclean thoughts” have their souls snatched by the spirits of the Little Black People and will pass out until the shaman revives them.
Miles said the shaman seemed to serve a public-order function by chasing off those who were too drunk or out of order.
The ceremonies are held in two places. The ritual began yesterday in Nanchuang Township, Miaoli County, and will carry on there until Monday. Rituals start today in Wufeng Township, Hsinchu County, and will last through tomorrow.
Getting there:
To Wufeng:
Route 122 to Wufeng can be accessed off No. 1 Highway near Toufen.
To Nanchuang:
Take western No. 1 Highway. Near Toufen, take Route 124 toward Sanwan to Nanchuang. Shuttle buses will take visitors to the ritual site at Xiangtian Lake.
You are reading Rasta Livewire. For all things Africa, visit AfricaResource: The Place for Africa on the Net.
Related Posts:
- Ashkenazi Jews Worship the Sun (Ra) - News
- Ancient Black Chinese From East Africa -- (by Prof Jin Li)
- African Roots Of China
- Africa and Global Warming: Analyzing the Wild Claims of Doomsayers
- The Black African Foundation of China: The First Chinese
- Nigerian Satellite launched by China
- Africa/China Co-operation: 50 Year Review
- Different Shades of Black:The Black African Race is the Only Race, the Rest Are Just Different Shades of Black!!!
- The Black Jews of Africa Part 2: Jews of Nigeria, Senegal and Congo - Jide Uwechia
- In a Time When Sahara was Green Land...
http://news.bbc.co.uk/2/hi/science/nature/183392.stm
 | |||||||||||||||||||||||||
| Wednesday, September 30, 1998 Published at 02:21 GMT 03:21 UK Sci/Tech DNA traces Chinese back to Africa  DNA: May hold clues to the start of human life Genetic researchers say they have found fresh evidence that Chinese people are descended from Africans. The findings also add new weight to theories that all human life began in Africa. Academics from the University of Texas and their colleagues in China studied 28 population groups in China and concluded that most - if not all - had their genetic origins in Africa. They looked at pieces of DNA known as microsatellites, which are short, repeating DNA segments that yield information about genetic variation among people. The researchers found that all Chinese have a great deal in common genetically, although there are some regional variations.
This theory contends that homo sapiens, the modern form of human life, is descended from a population of ancestors who migrated out of Africa about 100,000 years ago. The new data also supports the idea of an "African Eve" who is an ancestor of all living humans. The Eve hypothesis, first published in 1987, suggests that all human DNA can be traced back to a single female. This "Eve" would have lived in Africa about 200,000 years ago. The latest research challenges an alternative theory which holds that several different groups of humans evolved separately at the same time in several places around the world. Chinese mythology holds that the Chinese are descended from a single ancestor, the Yellow Emperor. More recent Chinese scholarship has argued that the Chinese evolved separately from other races.
| ||||||||||||||||||||||||
![[ image: Mythology holds that the Chinese are descended from a single ancestor]](http://news.bbc.co.uk/olmedia/180000/images/_183392_150chinese_factory_worker_pa.jpg)
http://www.ncbi.nlm.nih.gov/pubmed/1510113
- 1: Am J Phys Anthropol. 1992 May;88(1):27-36.
-
Origin of the Koreans: a population genetic study.
Department of Paediatrics, National University of Singapore.
A population genetic study was undertaken to investigate the origin of Koreans. Thirteen polymorphic and 7 monomorphic blood genetic markers (serum proteins and red cell enzymes) were studied in a group of 437 Koreans. Genetic distance analyses by both cluster and principal components models were performed between Koreans and eight other populations (Koreans in China, Japanese, Han Chinese, Mongolians, Zhuangs, Malays, Javanese, and Soviet Asians) on the basis of 47 alleles controlled by 15 polymorphic loci. A more detailed analysis using 65 alleles at 19 polymorphic loci was performed on six populations. Both analyses demonstrated genetic evidence of the origin of Koreans from the central Asian Mongolians. Further, the Koreans are more closely related to the Japanese and quite distant from the Chinese. The above evidence of the origin of Koreans fits well with the ethnohistoric account of the origin of Koreans and the Korean language. The minority Koreans in China also maintained their genetic identity.
http://www.raceandhistory.com/cgi-bin/forum/webbbs_config.pl/noframes/read/2054
african origin of chinese civilization
Posted By: Quinton
Date: 18, November 06, at 1:48 p.m.
Well even though genetics has proven that chinese people and african people have common genes, that doesnt mean that Africans were the ones who originated chinese civilization. If Africans were the ones who established the xia and shang dynasties, wouldnt there be linguistic connections as well between african people and chinese people? Why is it that the chinese language and african languages and cultures are so different? I know as a zoologist and a taxonomist that genetic evidence cannot be taken as the be all and end all of evidence, it cannot disprove/prove something 100%. It has to be taken in with other evidences as well. And as a zoologist I have found many instances where genetic evidence has gone completely against all the other evidences. For instance, I am specializing in parasitology. There are two groups of closely related genera of parasites known as Diplozoon and Paradiplozoon. There are huge mophological, anatomical, physiological and ecological differences between the two genera. And yet when geneticists studied them they only found that there was a difference of 11 DNA base pairs between the two genera. Because the genetic evidence indicated that they were basically the same, they wanted to lump the two genera together. You cant do that!!! you cannot take one piece of evidence (ie: the genetic analysis) and throw away all the other evidences (anatomy, morphology, physiology, ecology, etc)???!!! Chinese thought and culture is still very different from African thought and culture. Even though there may be a genetic connection, that doesnt prove there is a cultural connection. For instance, the xia and shang (africans?) worked with bronze. Whereas there is no evidence to prove that the people in africa worked with bronze. The point that I am trying to make is that even though there were africans in ancient china, those africans had already separately themselves (culturally) from Africa, so that they were no longer african once they reached china. Therefore chinese thought and culture is still chinese thought and culture. African language and culture had nothing to do with the origins of chinese culture. I am a chinese person who was born and raised in Africa and i dont see any correlation between chinese and african culture.Another thing I'd like to add is that there was no such a thing as "culture" 60 000 years ago. Its the same with Europeans, even though all races originated from africa, that does not mean that they are culturally african. Please people get dont jump to conclusions.
http://testingdna.blogspot.com/2008/01/dna-clues-on-african-origin-of-chinese.html
January 2, 2008
DNA clues on the African origin of Chinese populations
Modern man, or Homo sapiens, might have migrated from Africa into China by way of Southeast Asia between 18000 and 60000 years, researchers say.
This latter finding, the search for Chinese scientists and their international colleagues concluded that modern humans might have moved from Africa to China to replace Mono erectus (archaic of walking upright human beings) , to become the ancestors of the country \ 'modern man.
The conclusion is based on the comparison and analysis of the Y chromosome using DNA samples of 88 existing populations in East Asia, Southeast Asia and Oceania , said Li Jin, one of the Chinese researchers of the study "Chinese Human Genome Diversity Project. \ "
Li Jin is a professor of both the National Human Genome Center in Shanghai and the Institute of Genetics, Fudan University.
Scientists have found that variations in the Y chromosome in northern China are derived from those in the south of China, the fact that a small number of settlers of African origin moved to the north of China because of the obstacle of the powerful Yangtze River. And Polynesians, who live in the islands of the Pacific Ocean, are found to have different Y chromosome in Taiwan, forcing scientists to reconsider the hypothsis that Polynesians are the descendants of the ancestors of Taiwanese aborigines.
In general, almost all Y-chromosome variations in East Asia and Oceania could be found among those in Southeast Asia, said Li Jin.
Therefore, the results also indicate that modern humans migrated from Africa to Southeast Asia almost 60000 years.
Subsequently, the migrants are believed to have headed for two directions: one moved north to the south of China before spreading in the country \ 's north across the river Yangtze, and the other went to Indonesia and finally reached the Oceania.
The Y-chromosome research is an important method for tracing the migration patterns of men and the results clearly show the relationships between groups of people in Southeast Asia and Asia and 'Oceania, according to another major Chinese researcher Jiayou Chu, a professor of the Chinese Academy of Medical Sciences.
The research result was published in today \ 's issuance of the Proceeding of National Academy of Sciences, an American journal.
The finding means that scientists have made progress in the pursuit of human origin, though the conclusion that human beings modern Chinese migrated from Africa remains controversial, "said Academician of the Academy Science Chinese Zhu Chen, who is also the director of Shanghai \ 'S National Human Genome Center.
In 1987, the United States \ 'scientists postponed a theory based on mitochondrial DNA evidence that all human beings from Africa and later migrated to other corners of the globe. Intentional in academia, few arguments were raised about the theory that all humanity palaeoanthropic originated in Africa. Meanwhile, scientists noted that the fossils of Peking Man who lived 500000 years ago and Yuanmao Man more than 1.7 million years old have been discovered in China, but both lack any direct link with hereditary Chinese modern man.
There is a disconnection or "faultage" in the fossil palaeoanthropic Chinese who lived some 60000 to 100000 years, researchers say.
Coinciding with the fossil record, Chinese scientists discovered last year that primitive elements of DNA found in modern Chinese are identical to those found in Africans.
The discovery has provided evidence of weight on the genetic basis of the theory that modern Chinese were not changed since the archaic-walking upright human beings in China, but from Africa.
![]()
http://www.time.com/time/asia/magazine/2000/0117/cover.chineseroots.html
 China Pictorial DNA research contradicts theories, based on the "Peking Man" fossil, that hold Chinese to be the earliest modern humans. |
A team of researchers concludes that Chinese, like everyone else, came out of Africa
By ANTHONY SPAETH
According to ancient tradition, the Chinese were savages until a sage came along and taught them how to construct shelters. Later wise men taught, in succession, the use of fire, music and the cultivation of crops. The last of these sages was the Yellow Emperor Huangdi, the father of Chinese civilization. That tale, from the first century B.C., suggests that the process of human evolution took place in China--a notion that was boosted by the celebrated discovery in 1921 of Peking Man, a Homo erectus fossil unearthed outside Beijing. That led to claims, believed for decades in China, that Chinese were the earliest modern humans.
These days, the claims are getting a rough shaking from hard science--as is the notion that the Chinese are a unique, indigenous race. The Chinese Human Genome Diversity Project, a collaboration among 12 researchers from seven institutions, scrutinized DNA samples from 28 of China's 56 ethnic groups and then compared the samples with genetic material from other Asian and non-Asian groups. Their verdict: Chinese--like the rest of humanity--evolved in Africa. They migrated eastward along the Indian Ocean and made their way to China via Southeast Asia. "It is now safe to conclude," reported the researchers, "that modern humans originating in Africa constitute the majority of the current gene pool in Asian populations."
| |||||
The Chinese researchers, led by Shanghai-born Jin Li, a professor at the Human Genetics Center at the University of Texas in Houston, studied genetic markers known as microsatellites, which are short segments of DNA known to change rapidly and distinctively over time. By comparing DNA microsatellites from Chinese, East Asian, African and other races, they came up with an evolutionary pedigree and even a time frame for various DNA alterations. Their theory is that modern humans entered China from the south 40,000 to 60,000 years ago.
That contradicts old theories revolving around Peking Man. The Homo erectus specimen, discovered in the Zhoukoudian cave in the suburbs of Beijing, is estimated to have lived 500,000 years ago; Homo erectus was the precursor to Homo sapiens. Peking Man's discovery made possible the idea that the missing link between the two species evolved in China--which the genetic theory flatly rejects.
But laboratory evidence isn't everything, according to Wu Xinzhi, professor at the Chinese Academy of the Sciences' Institute of Vertebrate Paleontology and Paleoanthropology in Beijing, who is one of China's foremost scholars on early humans. The septuagenarian Wu has conducted decades of research into the issue of early Chinese humans and says there are many strong challenges to the theory, which was first released in 1998. If Homo sapiens migrated to China, Wu says, he would have brought more advanced tools, similar to those found in Middle Eastern excavations. With one exception, no such tools have been found.
Wu plucks a skull specimen from a bookshelf of his Beijing office and ticks off the distinctive features of the various prehistoric Homo sapiens skeletons unearthed in China: "Their face is comparatively flat, their nose is flat, the upper front teeth are shovel-shaped." Up to 90% of modern Chinese have such facial features, he says. "If I stand at the gate of the United Nations building," says Wu, "I can correctly identify a Mongolian, a European, an African. Why?" His contention: the theory that Homo sapiens migrated outward from Africa may be true in Europe, but China went through a different evolutionary process. "The theory is definitely wrong in China," he insists. "For the modern human origins in China and the Oriental region, continuity is the main trend and hybridization (immigrants interbreeding with indigenous people) is subsidiary."
Wu admits he's no geneticist but he says Jin and his team should "pay more attention to hard materials, not just soft ones." He also concedes that paleontologists have yet to unearth any Homo sapiens remains older than 50,000 years, which lends credence to the genetic theory. The government is allocating more money in the search for such evidence. "But its main interest," says Wu, "is in earlier remains--earlier than 2 million years." Such remains might cast light on earlier evolution, but if China wants to prove that humans evolved uniquely on its soil, it will have to cast its net closer in time--and find the missing evidence.
Reported by Jaime A. FlorCruz/Beijing
http://www.sciencemag.org/cgi/content/abstract/292/5519/1151
Science 11 May 2001: |
Reports
African Origin of Modern Humans in East Asia: A Tale of 12,000 Y Chromosomes

To test the hypotheses of modern human origin in East Asia, we sampled 12,127 male individuals from 163 populations and typed for three Y chromosome biallelic markers (YAP, M89, and M130). All the individuals carried a mutation at one of the three sites. These three mutations (YAP+, M89T, and M130T) coalesce to another mutation (M168T), which originated in Africa about 35,000 to 89,000 years ago. Therefore, the data do not support even a minimal in situ hominid contribution in the origin of anatomically modern humans in East Asia.
* These authors contributed equally to this work.
To whom correspondence should be addressed. E-mail: ljin@fudan.edu or ljin@sph.uth.tmc.eduhttp://english.people.com.cn/english/200007/15/eng20000715_45573.html
New Genetics Evidence Proves African Origin of Modern Chinese
Modern humans, or Homo sapiens, might migrate from Africa into China by way of Southeast Asia between 18,000 years and 60,000 years ago, researchers say.This latest research finding by Chinese scientists and their international colleagues concluded that modern humans might have moved from Africa to China replacing Mono erectus (archaic upright- walking human beings) there to become the ancestors of the country 's modern humans.
The conclusion is based on the comparison and analysis of Y- chromosome DNA using samples of the extant 88 populations living in East Asia, Southeast Asia and the Oceania, says Li Jin, one of the Chinese researchers of the study "Chinese Human Genome Diversity Project."
Li Jin is a professor of both the National Human Genome Center in Shanghai and the Institute of Genetics of Fudan University.
Scientists found that the variations of Y-chromosome in north China are derived from those in south China, a result proved as that a small number of settlers of African origin moved to northern China due to the hurdle of the mighty Yangtze River. And Polynesians, who live in the islands in the Pacific Ocean, are found to have different Y-chromosome to Taiwanese, forcing scientists to reconsider the hypothsis that Polynesians were descendants of ancestral Taiwanese aborigines.
As a whole, nearly all Y-chromosome variations in East Asia and the Oceania could be found among those in Southeast Asia, adds Li Jin.
So, the findings also indicate that modern humans migrated from Africa to Southeast Asia nearly 60,000 years ago.
Subsequently, the migrants were believed to have headed for two directions: one moved northwards to south China and then spread to the country's northern areas by crossing the Yangtze River, and the other went to Indonesia and ultimately reached the Oceania.
The Y-chromosome research is an important method for tracing the human migration patterns and the findings make clear the relationships between people groups in Southeast Asia, and East Asia and the Oceania, says another major Chinese researcher Jiayou Chu, who is a professor of the Chinese Academy of Medical Sciences.
This latest research result was published in today's issue of the Proceeding of National Academy of Sciences, a U.S. journal.
The finding means that scientists have made headway in the pursuit of human origin, though the conclusion that modern Chinese human beings migrated from Africa still remains controversial, says academician of the Chinese Academy of Sciences Zhu Chen, who is also the director of Shanghai's National Human Genome Center.
In 1987, the U.S.'s scientists brought forward a theory based on mitochondrial DNA evidence that all human beings originated in Africa and later migrated to other corners of the globe. In the intentional academic circles, few arguments were raised about the theory that all palaeoanthropic mankind originated in Africa. Meanwhile, the scientists note that fossils of Peking Man who lived 500,000 years ago and Yuanmao Man over 1.7 million years ago were found in China, but both lack any direct hereditary connection with modern Chinese man.
There is a disconnection or "faultage" in fossils of palaeoanthropic Chinese who lived some 60,000 to 100,000 years ago, researchers say.
Coinciding with the fossil record, Chinese scientists discovered last year that primitive elements of DNA found in modern Chinese are identical with those found in Africans.
The discovery has provided weighty evidence on the genetic basis for the theory that modern Chinese were not evolved from the archaic upright-walking human beings in China but originated in Africa.
http://en.wikipedia.org/wiki/Altaic_languages
Altaic languages
Altaic is a disputed language family that is generally held by its proponents to include the Turkic, Mongolic, Tungusic, Korean, and Japonic language families (Georg et al. 1999:73-74).[1] These languages are spoken in a wide arc stretching from northeast Asia through Central Asia to Anatolia and eastern Europe (Turks, Kalmyks).[2] The group is named after the Altai Mountains, a mountain range in Central Asia.
why do people on youtube say Korea is descendants of southeast asia? I find that a CRAZY notion. It's common sense that if any small percentage of similarities in genes exist, it could be through the Chinese. China invaded Korea throughout history, and it's possible that the southeast genes were tranferred by the Chinese during their invasion.
ReplyDelete